Common menu bar links
ARCHIVED - The Administrative Monetary Penalty System
 This page has been archived.
Archived Content
Information identified as archived is provided for reference, research or recordkeeping purposes. It is not subject to the Government of Canada Web Standards and has not been altered or updated since it was archived. Please contact us to request a format other than those available.
NATIONAL AMPS STATISTICS FOR 2006, 2007 AND 2008
Table of Contents
- Introduction
- AMPS Contraventions by Client Type and Year
- AMPS Contraventions by Penalty Level
- AMPS Penalty Levels by Client Type
- AMPS Client Type Volumes – Net 2006 to 2008
- AMPS Client Type Penalty Amounts 2006 to 2008
- All Client Volumes – Net
- All Client Penalty Amounts – Net
- Top 10 Contraventions
- AMPS Appeals
NATIONAL AMPS STATISTICS
FOR 2006, 2007 AND 2008
The following tables provide statistical information about the Administrative Monetary Penalty System (AMPS) penalties issued in 2006, 2007 and 2008. Data from years prior to 2006 has been omitted as the program was in its early development and data would not accurately reflect the AMPS program. Starting in 2010, Canada Border Services Agency (CBSA) will be providing bi-annual updates to illustrate the type and frequency of AMPS penalties at a national level.
The statistics identify three main client types: importers, carriers and warehouse operators. In all the tables, any data captured for Importers also takes into account exporters. A specific percentage figure of exporters vs. importers cannot be determined at this time. Statistics are also provided for penalties that apply specifically to couriers.
Contravention C244 is not included since this is a systems-generated warning for Customs Self-Assessment (CSA) clients. All figures, both volumes and values, are for all contraventions issued net of those that were cancelled. In other words, cancelled penalties are excluded in the calculation of statistics.
In addition to a breakdown by calendar year, statistics are broken down by various client types, penalty levels, top contraventions and appeals data. All penalty amounts and values are in Canadian dollars.
To learn more about each contravention, including penalty structures, basis and legislation, please consult the Master Penalty Document.
AMPS Contraventions by Client Type and Year
Table 1 provides an overview of the number of contraventions issued (net) for each year and major client type.
| AMPS Contraventions Volume – Net | ||||
|---|---|---|---|---|
| Client Type | 2006 | 2007 | 2008 | Totals |
| Importers | 9,464 | 11,421 | 9,378 | 30,263 |
| Carriers | 3,167 | 2,657 | 2,976 | 8,800 |
| Warehouse Operators | 508 | 659 | 1,033 | 2,200 |
| Totals | 13,139 | 14,737 | 13,387 | 41,263 |
Table 2 provides a summary and totals of penalty amounts (net) for each year and major client type.
| AMPS Penalty Amounts – Net | ||||
|---|---|---|---|---|
| Client Type | 2006 | 2007 | 2008 | Totals |
| Importers | $6,804,688 | $7,903,536 | $5,370,183 | $20,078,407 |
| Carriers | $4,525,921 | $2,963,224 | $2,871,803 | $10,360,948 |
| Warehouse Operators | $1,083,931 | $1,646,744 | $1,102,655 | $3,833,330 |
| Totals | $12,414,540 | $12,513,504 | $9,344,641 | $34,272,685 |
AMPS Contraventions by Penalty Level
Table 3 provides an annual summary of the net number of contraventions and penalty amounts issued per penalty level. Percentages illustrate the portion of total number of contraventions issued and penalty amounts (net) for each penalty level. For example, 81% of all contraventions issued (excluding C244 and cancelled penalties) are issued at Level 1. At the third level, a total of 10% of all contraventions are issued. However, this accounts for 37% of the total value of penalties issued since Level 3 penalties are at a higher/escalated penalty amount given that AMPS structure is graduated in most cases.
| Year | Level 1 | Level 2 | Level 3 | Level 4 | Total | |
|---|---|---|---|---|---|---|
| 2006 | Volume | 10,632 | 1,142 | 1,350 | 15 | 13,139 |
| Penalty | $6,192,917 | $994,159 | $5,186,718 | $40,746 | $12,414,540 | |
| 2007 | Volume | 11,636 | 1,180 | 1,902 | 19 | 14,737 |
| Penalty | $5,846,506 | $1,100,694 | $5,527,618 | $38,686 | $12,513,504 | |
| 2008 | Volume | 11,159 | 1,172 | 1,051 | 5 | 13,387 |
| Penalty | $5,800,631 | $1,375,247 | $2,116,806 | $51,957 | $9,344,641 | |
| Totals | Volume | 33,427 | 3,494 | 4,303 | 39 | 41,263 |
| Penalty | $17,840,054 | $3,470,100 | $12,831,142 | $131,389 | $34,272,685 | |
| As a % of Total | Volume | 81% | 8% | 10% | 0% | |
| Penalty | 52% | 10% | 37% | 0% |
AMPS Penalty Levels by Client Type
Table 4 provides a summary of the net number of contraventions and penalty amounts issued per penalty level and client type. Percentages illustrate the portion of total number of contraventions issued and penalty amounts (net) at each penalty level and client type.
| Volume | Penalty | |
|---|---|---|
| Level 1 | 25 093 (83 %) | $10,192,475 (51 %) |
| Level 2 | 2 737 (9 %) | $2,195,520 (11 %) |
| Level 3 | 2 397 (8 %) | $7,634,023 (38 %) |
| Level 4 | 36 (0 %) | $56,389 (0 %) |
| Totals | 30 263 | $20,078,407 |
| Volume | Penalty | |
|---|---|---|
| Level 1 | 7 219 (82 %) | $6,756,079 (65 %) |
| Level 2 | 411 (5 %) | $773,799 (7 %) |
| Level 3 | 1 168 (13 %) | $2,781,070 (27 %) |
| Level 4 | 2 (0 %) | $50,000 (0 %) |
| Totals | 8 800 | $10,360,948 |
| Volume | Penalty | |
|---|---|---|
| Level 1 | 1 115 (51 %) | $891,500 (23 %) |
| Level 2 | 346 (16 %) | $500,781 (13 %) |
| Level 3 | 738 (34 %) | $2,416,049 (63 %) |
| Level 4 | 1 (0 %) | $25,000 (1 %) |
| Totals | 2 200 | $3,833,330 |
| Volume | Penalty | |
|---|---|---|
| Level 1 | 33 427 (81 %) | $17,840,054 (52 %) |
| Level 2 | 3 494 (8 %) | $3,470,100 (10 %) |
| Level 3 | 4 303 (10 %) | $12,831,142 (37 %) |
| Level 4 | 39 (0 %) | $131,389 (0 %) |
| Totals | 41 263 | $34,272,685 |
AMPS Client Type Volumes - Net
2006 to 2008
Chart 1 illustrates the percentage of all contraventions issued (net) by client type between the years 2006 and 2008. For example, carriers accounted for 21% of all AMPS contraventions issued, importers for 74% and warehouse operators for 5%. Corresponds to figures in Table 4.

AMPS Client Type Penalty Amounts
2006 to 2008
Chart 2 illustrates the percentage of value of penalty amounts by client type between the years 2006 and 2008. For example, warehouses accounted for 11% of the net values of AMPS penalties issued, carriers for 30% and importers for 59%. Corresponds to figures in Table 4.

All Client Volumes – Net
Chart 3 illustrates the total number of all contraventions issued (net) for all client types for each year. Corresponds to figures in Table 3.

All Client Penalty Amounts – Net
Chart 4 illustrates the total value of all contraventions issued (net) for all client types for each year. Corresponds to figures in Table 3.

Top 10 Contraventions
Top 10 list includes:
- Top 10 AMPS Contraventions
- Top 10 Border Contraventions
- Top 10 Trade Contraventions
- Top 10 Importer/Exporter Contraventions
- Top 10 Carrier Contraventions
- Top 10 Courier Contraventions
- Top 10 Warehouse Contraventions
Top 10 AMPS Contraventions
Table 5 represents the top ten most issued AMPS contraventions in decreasing order by number of contraventions issued (net). Contravention code, wording (allegation) and total number of penalties issued and corresponding penalty amounts (net) are indicated. For specific penalty structures for each contravention, please consult the Master Penalty Document.
| Code | Contravention | Total Volume | Penalty Amount |
|---|---|---|---|
| C336 | Person failed to pay duties on accounted goods. | 6,790 | $1,920,900 |
| C005 | Person failed to provide true, accurate and complete information. | 4,962 | $677,900 |
| C082 | Importer failed to correct tariff classification within 90 days. | 4,482 | $439,200 |
| C084-C151 | Importer failed to mark the goods. | 2,541 | $229,300 |
| C358 | Person removed unreleased goods from customs office or sufferance warehouse. | 2,070 | $6,292,537 |
| C021 | Carrier failed to report regular goods ($1,600 or greater). | 1,475 | $1,210,000 |
| C353 | Importer failed to pay duties as a result of a required correction – Valuation. | 1,424 | $873,487 |
| C071 | Person failed to provide permit/certificate or information before goods released. | 1,333 | $261,100 |
| C018 | Failure to transport passengers and crew to customs office. | 1,139 | $181,000 |
| C315 | Exporter failed to provide any export permit required. | 1,045 | $2,565,000 |
Top 10 Border Contraventions
Table 6 represents the top ten most issued border contraventions in decreasing order by number of contraventions issued (net). Border contraventions are AMPS penalties that are issued at the point of entry. These are mostly issued to carriers, warehouses, brokers and duty-free shop licensees, Customs Self Assessment (CSA) clients, exporters and in some cases, importers. Contravention code, wording (allegation), total number of penalties issued and corresponding penalty amounts (net) are indicated. For specific penalty structures for each contravention, please consult the Master Penalty Document.
| Code | Contravention | Total Volume | Penalty Amount |
|---|---|---|---|
| C336 | Person failed to pay duties on accounted goods. | 6,790 | $1,920,900 |
| C005 | Person failed to provide true, accurate and complete information. | 4,962 | $677,900 |
| C084-C151 | Importer failed to mark the goods. | 2,541 | $229,300 |
| C358 | Person removed unreleased goods from customs office or sufferance warehouse. | 2,070 | $6,292,537 |
| C021 | Carrier failed to report regular goods ($1,600 or greater). | 1,475 | $1,210,000 |
| C071 | Person failed to provide permit/certificate or information before goods released. | 1,333 | $261,100 |
| C018 | Failure to transport passengers and crew to customs office. | 1,139 | $181,000 |
| C315 | Exporter failed to provide any export permit required. | 1,045 | $2,565,000 |
| C362 | Exporter failed to indicate the General Export Permit (GEP) number. | 964 | $109,200 |
| C033 | Carrier moved, delivered or exported goods without authorization ($1,600 or greater). | 756 | $729,000 |
Top 10 Trade Contraventions
Table 7 represents the top ten most issued trade contraventions in decreasing order by number of contraventions issued (net). Trade contraventions are AMPS penalties that are issued at post-release verification or during audits. These penalties are mostly issued to importers or any person failing to pay or repay duties as a result of required corrections or drawbacks. Contravention code, wording (allegation), total number of penalties issued and corresponding penalty amounts (net) are indicated. For specific penalty structures for each contravention, please consult the Master Penalty Document.
| Code | Contravention | Total Volume | Penalty Amount |
|---|---|---|---|
| C082 | Importer failed to correct tariff classification within 90 days. | 4,482 | $439,200 |
| C353 | Importer failed to pay duties as a result of a required correction – Valuation. | 1,424 | $873,487 |
| C352 | Importer failed to pay duties as a result of a required correction – Tariff. | 964 | $1,039,219 |
| C070 | Importer failed to account for goods in prescribed time. | 740 | $96,800 |
| C083 | Importer failed to correct value for duty within 90 days. | 519 | $51,900 |
| C215 | Person failed to repay duties relief not entitled to. | 254 | $58,362 |
| C214 | Person failed to report non-compliance with term/condition of duty relief or remission order. | 251 | $26,100 |
| C004 | Person failed to provide the correct SIMA code. | 240 | $132,073 |
| C080 | Importer failed to correct origin of Free Trade Agreement (FTA) goods within 90 days. | 201 | $20,100 |
| C350 | Importer failed to pay duties as a result of a required correction – Free Trade Agreement (FTA) origin. | 172 | $75,280 |
Top 10 Importer/Exporter Contraventions
Table 8 represents the top ten most issued importer/exporter contraventions in decreasing order by number of contraventions issued (net). An importer is defined as the person or entity that causes the goods to be imported and is responsible for accounting of the goods and paying applicable duties and taxes. In respect of goods that are exported, an exporter is defined as the holder of a business number for the purposes of the Customs Act who exports commercial goods or causes them to be exported. Contravention code, wording (allegation), total number of penalties issued and corresponding penalty amounts (net) are indicated. For specific penalty structures for each contravention, please consult the Master Penalty Document.
| Code | Contravention | 2006 | 2007 | 2008 | Total Volume | Penalty Amount |
|---|---|---|---|---|---|---|
| C336 | Person failed to pay duties on accounted goods. | 2,292 | 2,255 | 2,229 | 6,776 | $1,919,500 |
| C082 | Importer failed to correct tariff classification within 90 days. | 1,011 | 1,703 | 1,768 | 4,482 | $439,200 |
| C005 | Person failed to provide true, accurate and complete information. | 1,575 | 1,474 | 1,156 | 4,205 | $530,300 |
| C353 | Importer failed to pay duties as a result of a required correction – Valuation. | 214 | 768 | 442 | 1,424 | $873,487 |
| C071 | Person failed to provide permit/certificate or information before goods released. | 412 | 530 | 381 | 1,323 | $255,800 |
| C315 | Exporter failed to provide any export permit required. | 107 | 696 | 241 | 1,044 | $2,566,000 |
| C352 | Importer failed to pay duties as a result of a required correction – Tariff. | 128 | 492 | 344 | 964 | $1,039,219 |
| C362 | Exporter failed to indicate the General Export Permit (GEP) number. | 350 | 358 | 255 | 963 | $109,100 |
| C361 | Importer failed to report goods at time of release (less than $1,600). | 326 | 193 | 195 | 714 | $108,527 |
| C348 | Person intentionally provided false information. | 294 | 254 | 125 | 673 | $6,094,990 |
Importer Contravention Volumes - Net
Chart 5 illustrates the total number of all contraventions issued annually (net) for the importer client type. Corresponds to figures in Table 1.
Note: This client type also takes into account exporters. However, a specific percentage figure of exporters vs. importers cannot be determined at this time.

Importer Penalty Values - Net
Chart 6 illustrates total value of all contraventions issued annually (net) for the importer client type. Corresponds to figures in Table 2.
Note: This client type also takes into account exporters. However, a specific percentage figure of importers vs. exporters cannot be determined at this time.

Top 10 Carrier Contraventions
Table 9 represents the top ten most issued carrier contraventions in decreasing order by number of contraventions issued (net). A carrier is defined as an individual, partnership, or corporation engaged in the business of transporting goods or persons. Contravention code, wording (allegation), total number of penalties issued and corresponding penalty amounts (net) are indicated. For specific penalty structures for each contravention, please consult the Master Penalty Document.
| Code | Contravention | 2006 | 2007 | 2008 | Total Volume | Penalty Amount |
|---|---|---|---|---|---|---|
| C021 | Carrier failed to report regular goods ($1,600 or greater). | 191 | 508 | 760 | 1,459 | $2,061,000 |
| C358 | Person removed unreleased goods from customs office or sufferance warehouse. | 646 | 291 | 196 | 1,133 | $6,418,566 |
| C018 | Failure to transport passengers and crew to customs office. | 486 | 94 | 433 | 1,013 | $443,300 |
| C005 | Person failed to provide true, accurate and complete information. | 193 | 226 | 319 | 738 | $338,000 |
| C033 | Carrier moved, delivered or exported goods without authorization ($1,600 or greater). | 215 | 260 | 222 | 697 | $2,485,000 |
| C343 | Person failed to report in-bond cargo to customs outbound. | 209 | 204 | 191 | 604 | $1,211,000 |
| C354 | A carrier failed to provide advance passenger information. | 242 | 140 | 182 | 564 | $2,634,000 |
| C235 | CSA transporter used non-registered driver. | 209 | 205 | 5 | 419 | $607,800 |
| C008 | Carrier used incorrect carrier code or failed to use bar code for Cargo Control Number (CCN). | 199 | 119 | 62 | 380 | $1,070,100 |
| C347 | Carrier moved/delivered/exported unreleased goods valued less $1,600. | 91 | 90 | 97 | 278 | $73,700 |
Carriers by Transport Type 2006 – 2008
Table 10 summarizes the annual and total number (volume) of contraventions and penalty values (amount) issued (net) by the various modes of transport used by carriers. Contravention code, wording (allegation), total number of penalties issued and corresponding penalty amounts (net) are indicated. For specific penalty structures for each contravention, please consult the Master Penalty Document.
For further information and a description of the types of carriers listed in the table, please visit http://cbsa-asfc.gc.ca/services/carrier-transporteur/menu-eng.html.
| Mode of Transport | 2006 | 2007 | 2008 | Total Volume | Penalty Amount |
|---|---|---|---|---|---|
| Air | 729 | 284 | 650 | 1,663 | $1,958,764 |
| Bonded Highway Carriers | 1,440 | 1,416 | 1,127 | 3,983 | $4,914,425 |
| Non-bonded Highway Carriers | 574 | 493 | 433 | 1,500 | $1,945,769 |
| Railways | 97 | 225 | 84 | 406 | $362,027 |
| Freight Forwarders | 226 | 94 | 87 | 407 | $752,563 |
| Marine Vessels | 101 | 145 | 595 | 841 | $427,400 |
| Totals | 3,167 | 2,657 | 2,976 | 8,800 | $10,360,948 |
Carrier Contraventions by Penalty Level
Table 11 provides an annual summary of the total number (volume) of contraventions and penalty values (amount) issued (net) per penalty level for the carrier client type.
| Year | Level 1 | Level 2 | Level 3 | Level 4 | Totals | |
|---|---|---|---|---|---|---|
| 2006 | Volume | 2,441 | 180 | 546 | 0 | 3,167 |
| Penalty | $2,507,552 | $350,787 | $1,667,582 | $0 | $4,525,921 | |
| 2007 | Volume | 2,161 | 130 | 365 | 1 | 2,657 |
| Penalty | $2,093,690 | $211,087 | $633,447 | $25,000 | $2,963,224 | |
| 2008 | Volume | 2,617 | 101 | 257 | 1 | 2,976 |
| Penalty | $2,154,837 | $211,925 | $480,041 | $25,000 | $2,871,803 | |
| Totals | Volume | 7,219 | 411 | 1,168 | 2 | 8,800 |
| Penalty | $6,756,079 | $773,799 | $2,781,070 | $50,000 | $10,360,948 |
AMPS Volumes by Carrier Type
2006 - 2008
Chart 7 illustrates the percentage of all contraventions issued (net) for the carrier client type, by the various carrier types, between the years 2006 and 2008. Bonded highway carriers accounted for 44% of all AMPS contraventions issued by carrier client type, air carriers 19%, non-bonded highway carriers 17%, marine vessels 10%, while freight forwarders and railways were at 5% each . Corresponds to figures in Table 10.

AMPS Carrier Volumes - Net
Chart 8 illustrates total number of all contraventions issued annually (net) for the carrier client type. Corresponds to figures in Tables 1 and 11.

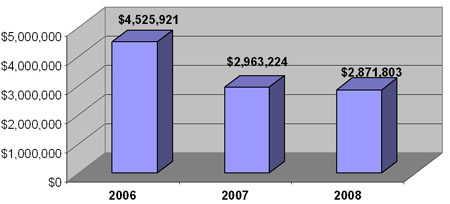
AMPS Carrier Penalty Amounts - Net
Chart 9 illustrates total value of all contraventions issued annually (net) for the carrier client type. Corresponds to figures in Tables 2 and 11.
Top 10 Courier Contraventions
Table 12 represents the top ten most issued courier contraventions in decreasing order by number of contraventions issued (net). A courier is defined as a commercial carrier that is engaged in the scheduled international transportation of shipments of goods other than goods imported by mail. Contravention code, wording (allegation), total number of penalties issued and corresponding penalty amounts (net) are indicated. For specific penalty structures for each contravention, please consult the Master Penalty Document.
| Code | Allegation | Volume | Penalty Amount |
|---|---|---|---|
| C358 | Person removed unreleased goods from Customs office or sufferance warehouse. | 822 | $2,556,585 |
| C347 | Carrier moved/delivered/exported unreleased goods valued less $1,600. | 126 | $12,600 |
| C026 | Person failed to present, open, unpack or unload goods for officer. | 107 | $266,000 |
| C033 | Carrier moved, delivered or exported goods without authorization ($1,600 or greater). | 99 | $99,000 |
| C274 | Goods reported as arrived when they are not arrived. | 57 | $12,000 |
| C005 | Person failed to provide true, accurate and complete information. | 48 | $8,900 |
| C063 | Sufferance warehouse licensee failed to provide list of goods not removed from warehouse. | 47 | $33,000 |
| C022 | Carrier failed to report regular goods (less than $1,600). | 46 | $4,600 |
| C331 | Courier failed to meet accounting time limit (consolidated B3). | 44 | $1,000 |
| C021 | Carrier failed to report regular goods ($1,600 or greater). | 32 | $32,000 |
Table 13 summarizes the number of contraventions and penalty amounts issued (net) for all AMPS contraventions and the courier category for the years 2006 through 2008. Courier contraventions account for 4% of all contraventions issued (net) and for 9% of AMPS penalty amounts.
| Courier Contraventions 2006 – 2008 | ||
|---|---|---|
| Volume | Penalty Amount | |
| All AMPS Contraventions – Net | 41,262 | $34,272,685 |
| Couriers contraventions – Net | 1611 | $3,252,894 |
| As a percentage of all AMPS | 4% | 9% |
Table 14 summarizes the number of penalties, penalty amounts issued (net), volume of courier releases and corresponding percentage values for the courier category for the years 2006 through 2008. AMPS penalties resulting from courier releases account for far less than 1% of all AMPS contraventions issued (net).
| Volume | Penalty | Courier Releases | AMPS Contraventions as a % of Releases | |
|---|---|---|---|---|
| 2006 | 598 | $1,263,652 | 32,246,776 | 0.002% |
| 2007 | 646 | $1,264,024 | 30,926,923 | 0.002% |
| 2008 | 367 | $725,218 | 31,768,052 | 0.001% |
| Total | 1611 | $3,252,894 | 94,941,751 | 0.002% |
Table 15 provides a summary of the number of contraventions and penalty amounts issued (net) per penalty level for the courier category for the years 2006 through 2008. Percentages illustrate the fraction of number of penalties issued and penalty amounts (net) at each penalty level. For instance, at Level 2, courier contraventions account for 6% of all contraventions issued and for 4% of all AMPS penalty amounts.
| Volume | % of Total | Penalty | % of Total | |
|---|---|---|---|---|
| Level 1 | 574 | 36% | $318,809 | 10% |
| Level 2 | 98 | 6% | $145,401 | 4% |
| Level 3 | 938 | 58% | $2,763,685 | 85% |
| Level 4 | 1 | 0% | $25,000 | 1% |
| Total | 1611 | $3,252,895 |
Note: Contravention C358 "Person removed unreleased goods from customs office or sufferance warehouse" represented 88% of all Level 3 penalties for courier companies.
Courier Volumes Chart
Chart 10 below illustrates total number (volume) of all contraventions issued (net) for the years 2006 through 2008 for the courier category. Corresponds to figures in Table 13.

Courier Penalty Chart
Chart 11 illustrates total amount (value) of all contraventions issued (net) for the courier category for the years 2006 through 2008. Corresponds to figures in Table 13.

Top 10 Warehouse Contraventions
Table 16 represents the top ten most issued warehousing contraventions in decreasing order by total number (volume) of contraventions issued (net). Warehouse contraventions are mostly applicable to carriers, exporters, duty-free shop licensees, sufferance warehouse licensees and bonded warehouse licensees. Contravention code, wording (allegation), total number of penalties issued and corresponding penalty amounts (net) are indicated. For specific penalty structures for each contravention, please consult the Master Penalty Document.
| Code | Contravention | 2006 | 2007 | 2008 | Total Volume | Penalty Amount |
|---|---|---|---|---|---|---|
| C358 | Person removed unreleased goods from customs office or sufferance warehouse. | 254 | 410 | 240 | 904 | $4,386,702 |
| C345 | Exporter failed to report goods subject to export control prior to export. | 0 | 0 | 578 | 578 | $6,000 |
| C063 | Sufferance warehouse licensee failed to provide list of goods not removed from warehouse. | 26 | 68 | 42 | 136 | $185,000 |
| C048 | Sufferance warehouse licensee failed to ensure safe storage of goods. | 41 | 39 | 52 | 132 | $488,000 |
| C347 | Carrier moved/delivered/exported unreleased goods valued less $1,600. | 64 | 7 | 7 | 78 | $28,600 |
| C049 | Sufferance warehouse licensee allowed access to unauthorized persons. | 6 | 21 | 19 | 46 | $50,500 |
| C033 | Carrier moved, delivered or exported goods without authorization ($1,600 or greater). | 18 | 14 | 12 | 44 | $122,000 |
| C066 | Person removed unreleased goods from a bonded warehouse or Duty Free shop. | 9 | 16 | 12 | 37 | $1,614,042 |
| C274 | Goods reported as arrived when they are not arrived. | 23 | 8 | 2 | 33 | $143,000 |
| C026 | Person failed to present, open, unpack or unload goods for officer. | 18 | 11 | 3 | 32 | $153,000 |
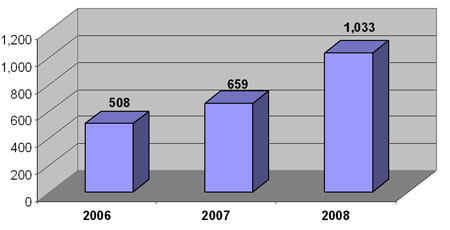
Warehouse Contravention Volumes – Net
Chart 12 illustrates the total number (volume) of all contraventions issued (net) for the years 2006 through 2008 for the warehouse client type. Corresponds to figures in Table 1.
Warehouse Penalty Amounts - Net
Chart 13 illustrates the total amount (value) of all contraventions issued (net) for the warehouse client type for the years 2006 through 2008. Corresponds to figures in Table 2.

AMPS Appeals
Table 17 depicts the number of appeals filed, all contraventions issued (gross) and corresponding results for the years 2006 through 2008. Of all AMPS contraventions that were appealed, Recourse Directorate upheld 69%, while 30% were cancelled or administratively closed. Twelve percent of all AMPS penalties issued were appealed; 4% were successful.
Note: Decisions taken by Recourse Directorate in a given year may also include appeals filed in previous years.
| AMPS Contraventions Appeals Results | |||||||||
|---|---|---|---|---|---|---|---|---|---|
| Action | 2006 | As a % of Decisions taken | 2007 | As a % of Decisions taken | 2008 | As a % of Decisions taken | Totals | As an Average % of Decisions taken | As an Average % of AMPS Issued |
| Contraventions - Issued | 16,381 | 19,020 | 14,313 | 49,714 | |||||
| Appeals Filed | 2,156 | 2,038 | 1,568 | 5,762 | |||||
| Penalty Upheld | 1,631 | 66% | 1,454 | 69% | 1,157 | 72% | 4,242 | 69% | |
| Penalty Cancelled | 830 | 33% | 616 | 29% | 435 | 27% | 1,881 | 30% | 4% |
| Administrative Closure | 29 | 1% | 22 | 1% | 13 | 1% | 64 | 1% | |
| Decisions Taken | 2,490 | 2,092 | 1,605 | 6,192 | 12% | ||||
The reasons for cancelling penalties were:
- The enforcement action was not warranted or justified (97%).
- The incorrect allegation was used by the issuing officer (2%).
- The penalty was not in accordance with Agency policies or guidelines (1%).