
Canada Border Services Agency: Quarterly Financial Report—For the quarter ended December 31, 2022
On this page
- 1. Introduction
- 2. Highlights of fiscal quarter and fiscal year-to-date (YTD) results
- 3. Risks and uncertainties
- 4. Significant changes in relation to operations, personnel and programs
- 5. Approval by senior officials
- 6. Table 1: Statement of authorities (unaudited)
- 7. Table 2: Departmental budgetary expenditures by standard object (unaudited)
1. Introduction
This Quarterly Financial Report (QFR) has been prepared as required by section 65.1 of the Financial Administration Act and in the form and manner prescribed by the Treasury Board. This quarterly report should be read in conjunction with the Main Estimates, Canada’s Economic Action Plan 2021 (Budget 2021) and Canada's COVID-19 Economic Response Plan.
Information on the raison d’être, mandate, role and core responsibilities of the Canada Border Services Agency (CBSA) can be found in Part III Departmental Plan and Part II of the Main Estimates.
The QFR has not been subjected to an external audit or review, but has been reviewed internally by the Departmental Audit Committee.
1.1 Basis of presentation
This quarterly report has been prepared by management using an expenditure basis of accounting. The accompanying statement of authorities (Table 1) includes the department's spending authorities granted by Parliament, and those used by the department consistent with the Main Estimates and Supplementary Estimates (as applicable) for the 2021 to 2022 and 2022 to 2023 fiscal years. This quarterly report has been prepared using a special purpose financial reporting framework designed to meet financial information needs with respect to the use of spending authorities.
The authority of Parliament is required before money can be spent by the Government. Approvals are given in the form of annually approved limits through appropriation acts, or through legislation in the form of statutory spending authority for specific purposes.
When Parliament is dissolved for the purposes of a general election, section 30 of the Financial Administration Act authorizes the Governor General, under certain conditions, to issue a special warrant authorizing the Government to withdraw funds from the consolidated revenue fund. A special warrant is deemed to be an appropriation for the fiscal year in which it is issued.
The department uses the full accrual method of accounting to prepare and present its annual departmental financial statements that are part of the departmental results reporting process. However, the spending authorities voted by Parliament remain on an expenditure basis.
2. Highlights of fiscal quarter and fiscal year-to-date (YTD) results
This section highlights the significant items that contributed to the net increase or decrease in resources available for the year and actual expenditures as of the quarter ended .
Graph 1: Comparison of net budgetary authorities and expenditures as of , and (in thousands $)
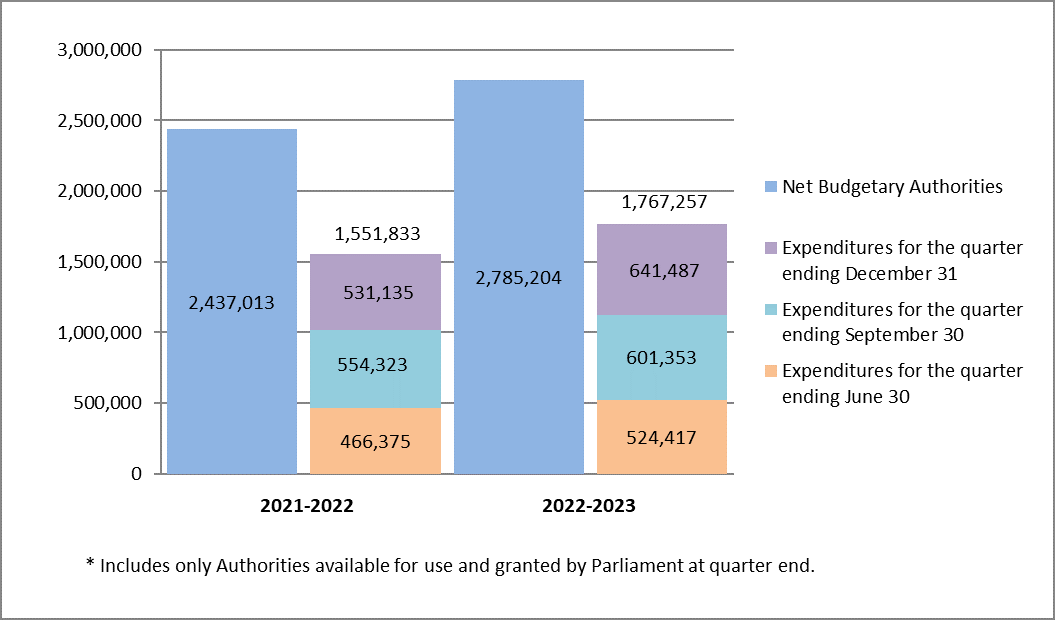
Image description
Graph 1: Comparison of net budgetary authorities and expenditures as of , and (in thousands $)
| 2021 to 2022 | 2022 to 2023 | |
|---|---|---|
| Net budgetary authorities | 2,437,013 | 2,785,204 |
| Expenditures for the quarter ending December 31 | 531,135 | 641,487 |
| Expenditures for the quarter ending September 30 | 554,323 | 601,353 |
| Expenditures for the quarter ending June 30 | 466,375 | 524,417 |
| Total expenditures to date | 1,551,833 | 1,767,257 |
2.1 Significant changes to authorities
For the period ending , the authorities provided to the CBSA comprise the Main Estimates, Supplementary Estimates B, and any unused spending authorities carried forward from the previous fiscal year.
The statement of authorities (Table 1) presents a net increase of $348.2 million or 14.3% of the Agency’s total authorities of $2,785.2 million on , compared to $2,437.0 million total authorities at the same quarter last year.
This net increase in the authorities available for use is the result of an increase in Vote 1 – Operating Expenditures of $250.4 million and an increase in Vote 5 – Capital of $56.5 million.
The Agency’s Statutory Authority related to the employee benefit plan (EBP) increased by $41.3 million, or 21.7% from the previous year.
2.2 Explanations of significant variances in expenditures from previous year
As indicated in the statement of authorities (Table 1), the Agency’s expenditures for year-to-date, at quarter ended , were $1,767.3 million, as compared to $1,551.8 million for year-to-date, quarter ended . The net increase of $215.4 million or 13.9% in expenditures is mainly due to the following items:
- Increase of $209.4 million or 15.7% in Vote 1 Operating Expenditures year-to-date used at quarter end. The increase in expenditures is mainly attributed to an increase in personnel expenditures, which are comprised of salary (including impact of newly negotiated collective agreements), overtime and vacation expenses.
- Decrease of $10.3 million or 13.4% in Vote 5 Capital Expenditures year-to-date used at quarter end. The decrease in expenditures is mainly attributed to a decrease in Facilities Capital Projects.
- Increase of $16.3 million or 11.4% in statutory expenditures.
As indicated in the departmental budgetary expenditures by standard objects (Table 2), the net increase by standard object is mainly attributed to:
- Increase of $178.5 million for Personnel due to salaries (including impact of newly negotiated collective agreements), overtime pay, meal allowance and vacation expenses.
- Increase of $19.7 million for Professional and Special Services can be attributed to a $11.0M increase for information technology consultants and a $8.7M increase in other professional services.
- Increase of $15.6 million for the Acquisition of machinery and equipment can mainly be attributed to a $4.6M increase in computer equipment, a $3.8M increase in video equipment and a $2.6M increase in laboratory equipment.
- Increase of $12.7 million for Transportation and Communications can be explained by a $12.0M increase in travel, following the lifting of COVID-19 restrictions.
- Increase of $7.8 million in revenues netted against the expenditures.
- Increase of $4.9 million in Repair and Maintenance can mainly be attributed to an increase in computer repairs, hardware & software and an increase in facilities non-capital projects.
- Increase of $2.3 million in Other Subsidies and Payments mainly due to an increase in claims against the Crown.
- Decrease of $13.8 million in Acquisition of Land, Buildings and Equipment due to a decrease in facilities capital projects.
Graph 2: Comparison of vote netted revenue and revenue collected as of , and (in thousands $)

Image description
Graph 2: Comparison of vote netted revenue and revenue collected as of , and (in thousands $)
| 2021 to 2022 | 2022 to 2023 | |
|---|---|---|
| Vote netted revenue | 24,030 | 24,030 |
| Revenue collected for the quarter ending December 31 | 4,957 | 7,025 |
| Revenue collected for the quarter ending September 30 | 3,808 | 7,181 |
| Revenue collected for the quarter ending June 30 | 1,259 | 3,584 |
| Total revenue collected to date | 10,024 | 17,790 |
The planned revenue from the sales of services reflects the Agency’s revenue respending authority. The year-to-date revenue from the charge of services has increased by $7.8 million or 77.5% due to the reopening of borders and increased travel after the lifting of COVID-19 restrictions. The increased travel has resulted in higher revenues collected in programs such as Nexus.
3. Risks and uncertainties
The CBSA’s changing operating environment makes the Agency particularly susceptible to external drivers that are largely beyond its control (e.g. COVID-19 impacts). Together, these drivers have the potential to affect the organization’s ability to manage its annual financial plan.
Since the beginning of the year, the annual inflation rate rose significantly to levels not seen in decades. Combined with a very competitive labour market, these factors have heightened the Agency’s exposure to risks that relate to achieving its goals in a timely fashion and within allocated budgets.
For example, the Agency is pursuing several large information technology (IT) and physical infrastructure projects; most are multi-year in nature and represent substantial investments. Because the CBSA depends on other government departments and/or external stakeholders for the development and implementation of many of these projects, any delays due to the impacts associated with the COVID-19 pandemic and workforce availability both within and outside the Agency can have a significant impact on these projects. Even short delays may incur additional costs for materials and market related services.
Despite the easing of health restrictions related to COVID-19 late in the second quarter (both with the return to the office workplace and with the removal of border measures related to the pandemic), workforce availability has remained a challenge. The transition to the Hybrid Work Model, along with the resurgence of other respiratory diseases have impacted labour force availability.
Despite these external factors, the Agency has met key deadlines and deliverables on the majority of its projects, and remains on track to meet the next set of deliverables. The Agency strives to mitigate financial risks by conducting regular reviews, which are informed by the Agency’s quarterly integrated project reporting processes.
4. Significant changes in relation to operations, personnel and programs
4.1 Key senior personnel
Holly Flowers Code was appointed as the new Vice-President of the Human Resources Branch on .
4.2 Operations
On , the Government of Canada removed all COVID-19 entry restrictions, as well as testing, quarantine, and isolation requirements for anyone entering Canada. All travelers, regardless of citizenship, no longer have to:
- submit public health information through the ArriveCAN app or website
- provide proof of vaccination
- undergo pre- or on-arrival testing
- carry out COVID-19-related quarantine or isolation
- monitor and report if they develop signs or symptoms of COVID-19 upon arriving to Canada
Also on , as part of the Traveller Modernization initiative, the Agency started to allow travellers to submit their customs and immigration declaration in advance of their arrival at several major airports by using the ArriveCan app (the previous CanBorder eDeclaration app was decommissioned). Since then, the use of the advance CBSA declaration feature in ArriveCan has been expanded to include the Halifax Stanfield International Airport and Quebec City’s Jean Lesage International Airport. Furthermore, Vancouver International Airport launched dedicated express lanes for travellers who submit their customs and immigration information in advance using ArriveCAN. For more information on the costs to develop, operate and maintain the ArriveCAN application, please consult ArriveCAN costs.
5. Approval by senior officials
Approved by:
Erin O'Gorman
President
Ted Gallivan
Executive Vice-President
Ottawa, Canada
Date:
Jonathan Moor
Chief Financial Officer
Ottawa, Canada
Date:
6. Table 1: Statement of authorities (unaudited)
| Total available for use for the year ending Tablenote 1 ($ thousands) | Used during the quarter ended ($ thousands) | Year-to-date used at quarter end ($ thousands) | |
|---|---|---|---|
| Vote 1: Operating expenditures | 2,282,786 | 557,737 | 1,541,068 |
| Vote 5: Capital expenditures | 270,497 | 30,476 | 66,329 |
| Statutory authority: Contributions to employee benefit plans | 231,921 | 53,094 | 159,282 |
| Statutory authority: Refunds of amounts credited to revenues in previous years | 0 | 0 | 3 |
| Statutory authority: Spending of proceeds from the disposal of surplus Crown assets | 0 | 180 | 575 |
| Total budgetary authorities | 2,785,204 | 641,487 | 1,767,257 |
| Non-budgetary authorities | 0 | 0 | 0 |
| Total authorities | 2,785,204 | 641,487 | 1,767,257 |
| Total available for use for the year ending Tablenote 2 ($ thousands) | Used during the quarter ended ($ thousands) | Year-to-date used at quarter end ($ thousands) | |
|---|---|---|---|
| Vote 1: Operating expenditures | 2,032,399 | 450,759 | 1,331,667 |
| Vote 5: Capital expenditures | 214,028 | 32,193 | 76,636 |
| Statutory authority: Contributions to employee benefit plans | 190,586 | 47,647 | 142,940 |
| Statutory authority: Refunds of amounts credited to revenues in previous years | 0 | 17 | 18 |
| Statutory authority: Spending of proceeds from the disposal of surplus Crown assets | 0 | 519 | 572 |
| Total budgetary authorities | 2,437,013 | 531,135 | 1,551,833 |
| Non-budgetary authorities | 0 | 0 | 0 |
| Total authorities | 2,437,013 | 531,135 | 1,551,833 |
7. Table 2: Departmental budgetary expenditures by standard objects (unaudited)
| Amount for the year ending Tablenote 3 ($ thousands) | Amount for the quarter ended ($ thousands) | Year-to-date at quarter end ($ thousands) | |
|---|---|---|---|
| Expenditures | |||
| Personnel | 1,847,214 | 465,219 | 1,353,397 |
| Transportation and communications | 58,944 | 15,113 | 36,151 |
| Information | 2,826 | 310 | 1,604 |
| Professional and special services | 585,202 | 118,578 | 285,049 |
| Rentals | 17,022 | 3,251 | 7,557 |
| Repair and maintenance | 62,194 | 14,678 | 26,125 |
| Utilities, materials and supplies | 32,997 | 5,043 | 12,565 |
| Acquisition of land, buildings and works | 40,353 | 7,524 | 15,829 |
| Acquisition of machinery and equipment | 119,565 | 19,398 | 37,655 |
| Transfer payments | 0 | 0 | 0 |
| Other subsidies and payments | 42,917 | -602 | 9,115 |
| Total gross budgetary expeditures | 2,809,234 | 648,512 | 1,785,047 |
| Less revenues netted against expenditures | |||
| Sales of services | 24,030 | 7,025 | 17,793 |
| Other revenue | 0 | 0 | -3 |
| Total revenues netted against expenditures | 24,030 | 7,025 | 17,790 |
| Total net budgetary expenditures | 2,785,204 | 641,487 | 1,767,257 |
| Planned expenditures for the year ending Tablenote 4 ($ thousands) | Expended during the quarter ended ($ thousands) | Year-to-date used at quarter end ($ thousands) | |
|---|---|---|---|
| Expenditures | |||
| Personnel | 1,714,936 | 388,077 | 1,174,941 |
| Transportation and communications | 64,127 | 9,625 | 23,502 |
| Information | 1,831 | 143 | 628 |
| Professional and special services | 409,330 | 97,318 | 265,337 |
| Rentals | 14,516 | 2,855 | 6,621 |
| Repair and maintenance | 36,659 | 10,833 | 21,186 |
| Utilities, materials and supplies | 20,124 | 4,659 | 11,200 |
| Acquisition of land, buildings and works | 90,035 | 11,121 | 29,610 |
| Acquisition of machinery and equipment | 99,990 | 10,607 | 22,036 |
| Transfer payments | 0 | 0 | 0 |
| Other subsidies and payments | 9,495 | 854 | 6,796 |
| Total gross budgetary expenditure | 2,461,043 | 536,092 | 1,561,857 |
| Less revenues netted against expenditures | |||
| Sales of services | 24,030 | 4,974 | 10,042 |
| Other revenue | 0 | -17 | -18 |
| Total revenues netted against expenditures | 24,030 | 4,957 | 10,024 |
| Total net budgetary expenditures | 2,437,013 | 531,135 | 1,551,833 |
Page details
- Date modified: