
Supporting materials: Standing Committee on Transport, Infrastructure and Communities: Airport Delays, Cancellations, ArriveCAN and Reimposed Measures on Travellers (August 19, 2022)
Issue notes
ArriveCan and border management
Issue: Current status of ArriveCAN regarding its use in Border Management and challenges faced by certain demographics
Proposed response
The Government is committed to protecting Canada’s borders and to helping travellers remain safe, which is paramount in the context of the global pandemic.
Public health measures at the border have been instrumental in helping Canada protect the health and safety of travellers and Canadians.
Technology, such as the ArriveCAN app, has been instrumental in protecting the health and safety of travellers as well as expediting processing at the border.
The ArriveCAN app only retains the information that is provided by the traveller and mandate under the current border health measures. This information is used for health screening purposes at the border, including allowing public health officials to determine the need for quarantine or isolation.
ArriveCAN was built using privacy-first principles, and the CBSA will continue to respect the principles of the Privacy Act as it modernizes its processes.
The CBSA will continue to use the ArriveCAN tool to implement traveller modernization initiatives at the border. For example, the optional Advance CBSA Declaration feature within ArriveCAN Online allows travellers arriving at Vancouver International Airport, Toronto Pearson International Airport and Montreal-Trudeau International Airport to prepare their customs and immigration declaration before they arrive, saving them time at the border. The featurewill be rolled out to additional international airports across Canada over the coming months.
The CBSA is committed to working with the Privacy Commissioner and other stakeholders to develop rigorous standards and governance that will protect the privacy of Canadians while continuing to modernize the management of Canada's borders.
The web version of ArriveCAN offers travellers access to a platform that meets the Government of Canada's accessibility requirements. It supports the use of screen readers and magnifiers. The CBSA and PHAC are committed to continue improving the accessibility of the ArriveCAN mobile application on a regular basis towards meeting international guidelines.
Background
In the face of the global COVID-19 pandemic, the Government of Canada has taken measures to close borders and drastically reduce international travel, in addition to many other heightened public safety measures. With the introduction of requirements for travellers to provide contact details and information on their plans for quarantine, the CBSA observed longer border processing times since modern tools were not used to collect and analyze information submitted by stakeholders.
To support the administration and enforcement of the Quarantine Act and Emergency Orders made under it, CBSA and PHAC developed ArriveCAN, an integrated digital solution that enables real-time collection of information prior to arrival at Canadian Ports of Entry (POE) for all incoming travellers. ArriveCAN enables travellers to provide their information digitally as required by law under the Quarantine Act, to support compliance and enforcement, as well as public health measures.
ArriveCAN first launched in and is available as a mobile app on the Apple App and Google Play stores or by signing in online at Canada.ca/ArriveCAN.
In , it became mandatory for air travellers to submit their information digitally in advance (i.e., before boarding the aircraft to Canada) via ArriveCAN. In , use of ArriveCAN became mandatory in the other modes (e.g., land, marine).
Currently, all travellers, with limited exceptions, whether entering Canada by air, land, rail or marine vessel, must use ArriveCAN to submit their information within 72 hours before arrival to Canada, unless exempted from this requirement due to an accessibility need.
Travellers who do not submit their information through ArriveCAN may be denied boarding if arriving by air and may be denied entry into Canada if crossing at a land, rail or marine border crossing (if the person is a foreign national travelling for discretionary purposes).
Canadian citizens, permanent residents, persons registered under the Indian Act and foreign nationals eligible to enter Canada under another entry exemption will not be denied boarding or entry, but:
- won't be eligible for the fully vaccinated traveller exemption
- may face additional delays at the border for public health questioning
- may be subject to fines or enforcement action
Once in Canada, requirements to quarantine and provide symptom information will differ depending on the traveller's vaccination status as confirmed at the time of entry to Canada.
Information provided through ArriveCAN is shared with provinces and territories and law enforcement agencies for public health follow-up and to verify compliance with the Quarantine Act. ArriveCAN is part of a broader suite of activities and tools supporting Canada's evolving border policies through COVID-19.
ArriveCAN has had consistently high ratings in the mobile app stores. As of , over 1.4 million travellers successfully completed their public health submission and as of , there have been 26,023,762 ArriveCAN submissions. For the week ending August 14, 99.65% of travellers in air mode used ArriveCAN, 90.27% used it in land mode, and 99.38% used it in marine mode. These numbers include travellers who have completed ArriveCAN both in advance and on site.
With the increase of vaccination rates and the opening of the border, the flow of international travel is expected to eventually return to pre-pandemic levels. When that happens, it will be important that the CBSA has processes in place to support passenger flow while minimizing any virus transmission that can occur from routine actions, such as exchanging a travel document.
As a result of the COVID-19 pandemic, the CBSA and airport authorities identified a need to bolster public confidence in air travel by introducing innovative traveller processing solutions which reduce potential disease transmission points and create efficiencies in the travel continuum.
As a result, the CBSA has developed a new initiative (Advance CBSA Declaration) which leverages the success of the ArriveCAN application and the significant investment made in Primary Inspection Kiosks (PIK), which are a key pillar of the Agency's border processing.
Advance CBSA Declaration was launched at the Vancouver International Airport in , Toronto Pearson International Airport in , and Montreal-Trudeau International Airport in . This feature is available on the ArriveCAN website and mobilie application and allows travellers to prepare their customs and immigration declaration and transmit it to the Agency electronically up to 72 hours in advance of arrival in Canada. Use of the Advance CBSA Declaration is voluntary. Travellers are provided the option of using this service following submission of mandatory public health information. Should a traveller decline to leverage this new tool, they will be subject to conventional processing.
These pilots have demonstrated time savings benefits for both the CBSA and travellers (up to 50% reduction in processing times at PIKs). The Agency is planning to deploy the functionality to additional airports in the 2022 to 2023 fiscal year.
COVID-19 Regulations as of May 31
The following measures that are in force as of for travellers entering Canada
All travellers
Mandatory digital submission of Public Health Information prior to entry into Canada via ArriveCAN
Fully vaccinated
- Right of Entry and Foreign National – No pre-arrival test required
- Subject to Mandatory Random Testing:
4600 tests daily, 3800 air (4 largest airports) and 800 land (large volume POEs only)
- No longer required for fully vaccinated travellers to monitor for signs and symptoms of COVID-19
- No longer required to isolate if they have travelled with a person who subsequently exhibits signs or symptoms or receives a positive result
- Exempt from providing a quarantine plan as part of their ArriveCAN submission
- Must provide their contact information in ArriveCAN
Unvaccinated travellers
- Foreign nationals - Prohibition from entering with limited exemptions
- Right of Entry – Required to provide pre-arrival test, test on day 1 and day 8 and quarantine for 14 days upon entry
- Must submit a quarantine plan as part of their ArriveCAN submission
Unvaccinated children under 5
- Foreign nationals- less than 18 years of age eligible to enter Canada
- with a fully vaccinated parent, step-parent, guardian or tutor, or
- to be with an immediate or extended family member or
- Exempted from Pre-Arrival test
- Exempted from day 1 and day 8 testing requirement
- Exempted from quarantine
- Exempted from Mandatory Random Testing requirement
Unvaccinated children 5 to 11
- Foreign nationals- less than 18 years of age eligible to enter Canada
- with a fully vaccinated parent, step-parent, guardian or tutor, or
- to be with an immediate or extended family member, or
- to attend a Designated Learning Institution with a COVID-readiness plan
- Unvaccinated children under to 12 subject to Mandatory Random Testing
- Unvaccinated children under 12 entering with their parents/step-parent/guardian or tutor, are exempt from having a quarantine plan
- Unvaccinated children under 12 when accompanied by fully vaccinated parents/step-parent/guardians or tutor are exempt from a pre-arrival testing
- Unvaccinated children between 5 and 11, entering to be with an Immediate or Extended family member or to attend a Designated learning Institution
- Must have a pre-arrival test
- Must quarantine for 14 days
- Must test on arrival and day 8
Unvaccinated children 12 to 17
- Foreign nationals- less than 18 years of are eligible to enter Canada
- with a fully vaccinated parent, step-parent, guardian or tutor, or
- to be with an immediate or extended family member, or
- to attend a listed institution (DLI with COVID readiness plan)
- Required to have a pre-arrival testing requirement
- Required to quarantine for 14 days
- Required to test on arrival and day 8
Persons with a medical contraindication
- Foreign nationals – eligible to enter if they have a letter from a medical practitioner indicating their medical contraindication to vaccination
- Right of entry and Foreign National – required to have a pre-arrival test
- Are required to test on arrival and on day 8
- Are exempt from quarantine, with conditions
National Interest Exemptions for land based travellers
- CBP officers who are unvaccinated or who failed to submit ArriveCAN who are transiting Canada to get to their place of employment in the US (renewed May 31)
- Crew members, entering by land, who failed to submit ArriveCAN (renewed May 31)
- Non-discretionary travel between Alaska and mainland US (renewed May 31)
- “Mulligan” NIE to decouple ArriveCAN completion from being fully vaccinated. Fully vaccinated travellers can benefit from being considered fully vaccinated despite not completing ArriveCAN the first time they enter after issuance (signed May 24)
NEXUS application backlog
Issue: Recent media coverage regarding NEXUS application backlog
Proposed response
The NEXUS program is jointly administered by Canada and the United States (US). As such, all program decisions are taken in a bi-national manner.
NEXUS enrolment centres were initially closed in March of 2020 as a direct result of the emerging global pandemic. They remained closed for over 2 years, thereby creating a backlog in renewals and new applications.
NEXUS enrolment centres reopened in the United States on . Canadian citizens and Permanent Residents can now book an interview at the nearest US enrolment centre in order to renew their membership, or obtain their first time membership.
Due to the extended closure of the NEXUS enrolment centres, there is a significant backlog to tackle. The CBSA and US Customs and Border Protection (US CBP) are working together on a backlog reduction strategy.
The CBSA and the US CBP have extended the NEXUS membership period for all existing NEXUS member who have applied for renewal of their existing membership prior to the expiry date on their card.
Canada and the US remain in discussions regarding the reopening of enrolment centres located in Canada that were closed as a result of COVID.
Canadian enrolment centers will remain closed until outstanding operational and program issues are resolved.
We will advise the public once a decision to reopen Canadian Enrolment Centres has been rendered.
Background
NEXUS program
NEXUS is a bi-national, Canada-United States program for pre-approved, low-risk travellers entering Canada or the United States at designated air, land and marine ports of entry.
The program is jointly operated by the Canada Border Services Agency and United States Customs and Border Protection.
Closure of Canadian enrolment centres
Due to the COVID-19 pandemic, NEXUS enrolment centres (ECs) in Canada closed on , and ECs in the US suspended NEXUS interviews at that time as well.
ECs in the US resumed NEXUS interviews on , but had to suspend them again on due to the Omicron variant and the resulting requirement for travellers to be tested for COVID before returning to Canada.
ECs in the US resumed NEXUS interviews again on .
As the NEXUS program is jointly administered by Canada and the US, there are ongoing discussions about the timing of the reopening of Canadian enrolment centres. Until that time, enrolment centres in Canada will continue to be closed.
The CBSA and CBP have received multiple complaints about Canadian ECs not reopening. This matter has also received media attention.
Due to the extended closure of NEXUS ECs, there is currently a backlog of more than 339,887 NEXUS applicants waiting for an interview.
The CBSA and CBP are currently working on a backlog reduction strategy.
The closure of NEXUS ECs throughout the pandemic has caused a high demand for interviews. As such, interview appointments may only be available months from now. Interview availability depends on interview location, as some ECs have longer wait times than others.
There are currently 12 NEXUS ECs conducting interviews in the US. An additional 11 NEXUS ECs are located in Canada, which remain closed for the moment. Refer to lists below.
Highway enrolment centre
- Blaine / Pacific Highway
- Calais / St. Stephen
- Champlain / Lacolle
- Derby Line / Stanstead
- Detroit / Windsor
- Fort Erie / Buffalo (Canadian location)
- Fort Frances / International Falls
- Lansdowne (Canadian location)
- Niagara Falls
- Pembina / Emerson
- Port Huron / Sarnia
- Sault Ste. Marie
- Sweetgrass / Coutts
- Warroad / Sprague
- Woodstock (Canadian location)
Air enrolment centre
- Calgary International Airport
- Edmonton International Airport
- Halifax International Airport
- Montreal International Airport
- Ottawa International Airport
- Toronto International Airport
- Vancouver International Airport
- Winnipeg International Airport
Key statistics
| July 25 to 31, 2022 | August 1 to 7, 2022 | Total | |
|---|---|---|---|
| Air | 599,593 | 609,795 | 1,209,388 |
| Land | 928,856 | 1,014,994 | 1,943,850 |
| Total | 1,528,449 | 1,624,789 | 3,153,238 |
| Data Source: CBSA Cognos - Passage Self-Serving Reporting | |||
| Downloads | (for iOS and Android up to ) | 16,976,718 |
| Submissions | (up to ) | 25,159,448 |
| July 25 to 31, 2022 (%) |
August 1 to 7, 2022 (%) |
||
|---|---|---|---|
| By mode | Air | 99.63 | 99.61 |
| Land | 90.45 | 90.32 | |
| By nationality group | Right of entry | 94.01 | 93.32 |
| Foreign nationals | 93.59 | 93.17 | |
| NEXUS / FAST members + unknown | 98.78 | 98.83 | |
| Includes travellers who have completed ArriveCAN both in advance and on site | |||
| July 18 to 24, 2022 | Jul 25 to 31, 2022 | Aug 1 to 4, 2022 | Total | ||
|---|---|---|---|---|---|
| By mode | Air | 1 | 2 | 0 | 3 |
| Land | 32,755 | 37,876 | 25,724 | 96,355 | |
| By nationality group | Right of entry + foreign nationals | 32,482 | 37,590 | 25,536 | 95,608 |
| NEXUS / FAST members + unknown | 290 | 299 | 210 | 799 | |
| Until , the Mulligan was only for travellers with a right of entry. However, in some instances, it has been incorrectly provided to travellers with a foreign identity document. From , the Mulligan was in place for foreign nationals but system updates to differentiate right of entry and foreign nationals were not available until | |||||
ArriveCAN feature releases
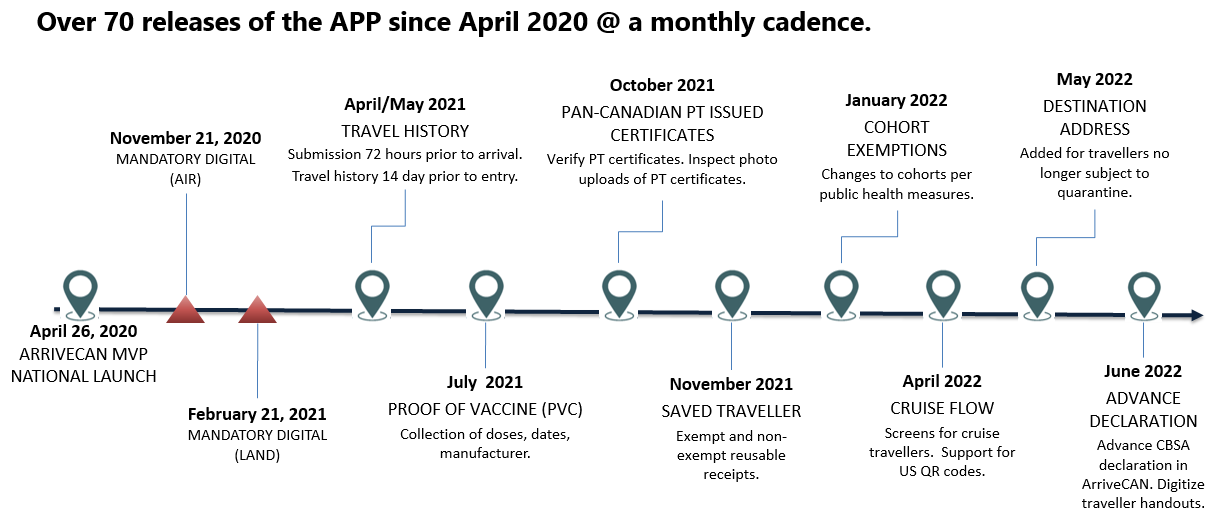
Figure 1 - Text version
Over 70 releases of the APP since @ a monthly cadence.
- : ArriveCAN MVP National Launch
- : Mandatory Digital (Air)
- : Mandatory Digital (Land)
- April/: Travel History – Submission 72 hours prior to arrival. Travel history 14 days prior to entry.
- : Proof of Vaccine (PVC) – Collection of doses, dates, manufacturer.
- : Pan-Canadian PT Issued Certificates – Verify PT certificates. Inspect photo uploads of PT certificates.
- : Saved Traveller – Exempt and non-exempt reusable receipts.
- : Cohort Exemptions – Changes to cohorts per public health measures.
- : Cruise Flow – Screens for cruise travellers. Support for US QR codes.
- : Destination Address – Added for travellers no longer subject to quarantine.
- : Advance Declaration – Advance CBSA declaration in ArriveCAN. Digitize traveller handouts.
ArriveCAN functionality
The Canada Border Services Agency (CBSA) can confirm that a glitch was identified on , and resolved on . This meant that despite having submitted all the required information and their proof of vaccination using the ArriveCAN app, some travellers received automated quarantine notifications when they should not have.
This notification glitch affected approximately 10,200 users prior to its resolution. While the Agency is aware that some ArriveCAN users have experienced individual issues, there have been no other widespread outages or critical incidents that caused travellers to receive erroneous quarantine messages.
The CBSA compiled a list of travellers affected by the notification glitch. This list was provided to the Public Health Agency of Canada (PHAC) who communicated with the travellers, as PHAC is responsible for the post-border quarantine program. For more information on communications with those affected, please reach out to PHAC directly at media@hc-sc.gc.ca.
A technical solution was identified and implemented the evening of July 20.
Fully-vaccinated travellers who have completed ArriveCAN and received quarantine notifications in error should still answer any phone calls they receive, and provide factual answers and/or follow the recommendation of any Government of Canada official with whom they speak.
Any travellers who is receiving ArriveCAN notifications can also contact the Government of Canada directly via the "technical and registration issues for ArriveCAN" web form and follow the instruction provided. The form, as well as a number of resources available to travellers for using ArriveCAN, is available at Contact us about ArriveCAN
There are a number of resources available to travellers that provide direction and information relating to interacting with the ArriveCAN app. Travellers experiencing technical issues with ArriveCAN can contact the Government of Canada directly via the "technical and registration issues for ArriveCAN" web form and follow the instruction provided.
When using ArriveCAN, travellers must ensure the most up-to-date version is downloaded on their device.
ArriveCAN daily reports
Daily NIEs by region and nationality: August 5 to August 7
Number and rate of travellers who used the ArriveCAN NIE by region and nationality
| Date | Nationality | Atlantic | Northern Ontario | Pacific | Prairies | Southern Ontario | Quebec | Total | Rate (%) |
|---|---|---|---|---|---|---|---|---|---|
| 05-Aug | Right of Entry | 122 | 257 | 691 | 291 | 1,273 | 663 | 3,297 | 52.5 |
| Foreign Nationals | 119 | 176 | 774 | 122 | 609 | 1,178 | 2,978 | 47.5 | |
| Total | 241 | 433 | 1,465 | 413 | 1,882 | 1,841 | 6,275 | 100.0 |
| Date | Nationality | Atlantic | Northern Ontario | Pacific | Prairies | Southern Ontario | Quebec | Total | Rate (%) |
|---|---|---|---|---|---|---|---|---|---|
| 06-Aug | Right of Entry | 172 | 297 | 1,111 | 351 | 1,419 | 1,074 | 4,424 | 52.7 |
| Foreign Nationals | 160 | 193 | 1,047 | 143 | 605 | 1,815 | 3,963 | 47.3 | |
| Total | 332 | 490 | 2,158 | 494 | 2,024 | 2,889 | 8,387 | 100.0 |
| Date | Nationality | Atlantic | Northern Ontario | Pacific | Prairies | Southern Ontario | Quebec | Total | Rate (%) |
|---|---|---|---|---|---|---|---|---|---|
| 07-Aug | Right of Entry | 260 | 294 | 1,324 | 578 | 1,609 | 1,491 | 5,556 | 63.6 |
| Foreign Nationals | 185 | 134 | 735 | 110 | 532 | 1,478 | 3,174 | 36.4 | |
| Total | 445 | 428 | 2,059 | 688 | 2,141 | 2,969 | 8,730 | 100.0 |
| Date | Nationality | Atlantic | Northern Ontario | Pacific | Prairies | Southern Ontario | Quebec | Total | Rate (%) |
|---|---|---|---|---|---|---|---|---|---|
| 3-Day total | Right of Entry | 554 | 848 | 3,126 | 1,220 | 4,301 | 3,228 | 13,277 | 56.8 |
| Foreign Nationals | 464 | 503 | 2,556 | 375 | 1,746 | 4,471 | 10,115 | 43.2 | |
| Total | 1,018 | 1,351 | 5,682 | 1,595 | 6,047 | 7,699 | 23,392 | 100.0 |
Notes / Caveats:
Data Source: ContactTrace Desktop Application (This is a live data warehouse and figures are subject to change).
Daily NIEs by region: August 8 to August 14
| Region / Date | Atlantic | Northern Ontario | Pacific | Prairies | Southern Ontario | Quebec | Total |
|---|---|---|---|---|---|---|---|
| 08-Aug | 384 | 402 | 1,511 | 480 | 2,185 | 1,273 | 6,235 |
| 09-Aug | 251 | 282 | 1,302 | 390 | 1,774 | 861 | 4,860 |
| 10-Aug | 220 | 267 | 1,561 | 402 | 1,871 | 1,087 | 5,408 |
| 11-Aug | 347 | 304 | 1,720 | 423 | 1,993 | 1,280 | 6,067 |
| 12-Aug | 416 | 349 | 1,929 | 492 | 2,776 | 1,835 | 7,797 |
| 13-Aug | 449 | 462 | 1,987 | 512 | 3,254 | 1,592 | 8,256 |
| 14-Aug | 378 | 544 | 2,125 | 518 | 3,046 | 1,598 | 8,209 |
| Number of times an NIE has been used in the last 7 days | 2,445 | 2,610 | 12,135 | 3,217 | 16,899 | 9,526 | 46,832 |
| Traveller volumes in the last 7-day | 25,434 | 66,724 | 130,661 | 39,735 | 223,856 | 100,420 | 586,830 |
| Rate of travellers who used an NIE in the last 7 days | 9.6% | 3.9% | 9.3% | 8.1% | 7.5% | 9.5% | 8.0% |
| Cumulative times an NIE has been usedTablenote 1 | 14,266 | 18,641 | 89,687 | 25,300 | 160,958 | 70,172 | 379,024 |
| Cumulative rate of travellers who have used an NIE | 5.3% | 2.7% | 6.4% | 6.8% | 6.8% | 8.1% | 6.4% |
This NIE can not be issued in Air Mode. This NIE is used for travellers with the Right of Entry (Canadian Citizens and Canadian Permanent Residents) and Foreign Nationals. This NIE can only be issued one time per traveller. Data Source: ContactTrace Desktop Application (This is a live data warehouse and figures are subject to change). |
|||||||
| Date | Nationality | Atlantic | Northern Ontario | Pacific | Prairies | Southern Ontario | Quebec | Total | Rate (%) | |
|---|---|---|---|---|---|---|---|---|---|---|
| Previous day | Aug 14 | Right of Entry | 221 | 391 | 1,326 | 425 | 1,080 | 1,505 | 4,948 | 60.3 |
| Foreign Nationals | 157 | 153 | 799 | 93 | 518 | 1,541 | 3,261 | 39.7 | ||
| Total | 378 | 544 | 2,125 | 518 | 1,598 | 3,046 | 8,209 | 100.0 | ||
| Last 7 days | Aug 08 to | CC/PR | 1,242 | 1,576 | 6,487 | 2,331 | 6,072 | 6,949 | 24,657 | 52.6 |
| FN | 1,203 | 1,034 | 5,648 | 886 | 3,454 | 9,950 | 22,175 | 47.4 | ||
| Total | 2,445 | 2,610 | 12,135 | 3,217 | 9,526 | 16,899 | 46,832 | 100.0 | ||
| CumulativeTablenote 2 | Jul 29 to | CC/PR | 3,080 | 4,105 | 17,173 | 6,122 | 17,679 | 17,525 | 65,684 | 56.3 |
| FN | 2,535 | 2,343 | 12,736 | 2,027 | 7,523 | 23,494 | 50,658 | 43.4 | ||
| Total | 5,620 | 6,458 | 30,163 | 8,150 | 25,218 | 41,133 | 116,742 | 100.0 | ||
Between July 29 – , there were 400 (0.3%) NIEs used by FAST, Nexus and Travellers whose Nationality was unknown. Data Source: ContactTrace Desktop Application (This is a live data warehouse and figures are subject to change). |
||||||||||
| Region | Atlantic | Greater Toronto Area | Northern Ontario | Pacific | Prairies | Quebec | Southern Ontario | |||||||
|---|---|---|---|---|---|---|---|---|---|---|---|---|---|---|
| Date | NoTablenote 3 | YesTablenote 4 | No | Yes | No | Yes | No | Yes | No | Yes | No | Yes | No | Yes |
| 08-Aug | 0 | 4 | 0 | 0 | 1 | 3 | 1 | 25 | 0 | 1 | 0 | 7 | 6 | 27 |
| 09-Aug | 0 | 0 | 0 | 0 | 3 | 12 | 12 | 37 | 0 | 5 | 2 | 14 | 8 | 18 |
| 10-Aug | 2 | 8 | 0 | 0 | 2 | 15 | 5 | 40 | 0 | 3 | 4 | 6 | 11 | 27 |
| 11-Aug | 1 | 19 | 0 | 0 | 2 | 10 | 6 | 56 | 2 | 7 | 1 | 23 | 15 | 53 |
| 12-Aug | 0 | 7 | 0 | 1 | 2 | 18 | 2 | 71 | 0 | 4 | 3 | 44 | 9 | 57 |
| 13-Aug | 6 | 12 | 0 | 0 | 3 | 34 | 10 | 98 | 2 | 9 | 6 | 38 | 19 | 90 |
| 14-Aug | 3 | 8 | 0 | 0 | 1 | 30 | 9 | 131 | 0 | 15 | 4 | 77 | 26 | 94 |
| Total | 12 | 58 | - | 1 | 14 | 122 | 45 | 458 | 4 | 44 | 20 | 209 | 94 | 366 |
| TotalTablenote 5 | 297 | 5,117 | 5 | 373 | 796 | 5,527 | 2,547 | 29,269 | 413 | 3,054 | 954 | 9,975 | 9,298 | 37,059 |
| Rate (%) | 5% | 95% | 1% | 99% | 13% | 87% | 8% | 92% | 12% | 88% | 9% | 91% | 20% | 80% |
| Data Source: ContactTrace Desktop Application (This is a live data warehouse and figures are subject to change). | ||||||||||||||
Daily NIEs by region: August 9 to August 15
| Region / Date | Atlantic | Northern Ontario | Pacific | Prairies | Southern Ontario | Quebec | Total |
|---|---|---|---|---|---|---|---|
| 09-Aug | 251 | 282 | 1,302 | 390 | 1,774 | 861 | 4,860 |
| 10-Aug | 220 | 267 | 1,561 | 402 | 1,871 | 1,087 | 5,408 |
| 11-Aug | 347 | 304 | 1,720 | 423 | 1,993 | 1,280 | 6,067 |
| 12-Aug | 416 | 349 | 1,929 | 492 | 2,776 | 1,835 | 7,797 |
| 13-Aug | 449 | 462 | 1,987 | 512 | 3,254 | 1,592 | 8,256 |
| 14-Aug | 378 | 544 | 2,125 | 518 | 3,046 | 1,598 | 8,209 |
| 15-Aug | 336 | 374 | 1,465 | 383 | 2,533 | 1,200 | 6,291 |
| Number of times an NIE has been used in the last 7 days | 2,397 | 2,582 | 12,089 | 3,120 | 17,247 | 9,453 | 46,888 |
| Traveller volumes in the last 7-day | 25,186 | 66,763 | 131,365 | 37,764 | 223,664 | 101,153 | 585,895 |
| Rate of travellers who used an NIE in the last 7 days | 9.5% | 3.9% | 9.2% | 8.3% | 7.7% | 9.3% | 8.0% |
| Cumulative times an NIE has been usedTablenote 1 | 14,602 | 19,015 | 91,152 | 25,683 | 163,491 | 71,372 | 385,315 |
| Cumulative Rate of travellers who have used an NIE | 5.4% | 2.7% | 6.4% | 6.8% | 6.8% | 8.1% | 6.4% |
This NIE can not be issued in Air Mode. This NIE is used for travellers with the Right of Entry (Canadian Citizens and Canadian Permanent Residents) and Foreign Nationals. This NIE can only be issued one time per traveller. Data Source: ContactTrace Desktop Application (This is a live data warehouse and figures are subject to change). |
|||||||
| Date | Nationality | Atlantic | Northern Ontario | Pacific | Prairies | Southern Ontario | Quebec | Total | Rate (%) | |
|---|---|---|---|---|---|---|---|---|---|---|
| Previous day | Aug 15 | Right of Entry | 151 | 228 | 885 | 267 | 722 | 1,060 | 3,313 | 52.7 |
| Foreign Nationals | 185 | 146 | 580 | 116 | 478 | 1,473 | 2,978 | 47.3 | ||
| Total | 336 | 374 | 1,465 | 383 | 1,200 | 2,533 | 6,291 | 100.0 | ||
| Last 7 days | Aug 09 to | Right of Entry | 1,190 | 1,555 | 6,475 | 2,251 | 5,971 | 6,993 | 24,435 | 52.1 |
| Foreign Nationals | 1,207 | 1,027 | 5,614 | 869 | 3,482 | 10,254 | 22,453 | 47.9 | ||
| Total | 2,397 | 2,582 | 12,089 | 3,120 | 9,453 | 17,247 | 46,888 | 100.0 | ||
| CumulativeTablenote 2 | Jul 29 to | Right of Entry | 3,231 | 4,333 | 18,058 | 6,389 | 18,401 | 18,585 | 68,997 | 56.1 |
| Foreign Nationals | 2,720 | 2,489 | 13,316 | 2,143 | 8,001 | 24,967 | 53,636 | 43.6 | ||
| Total | 5,620 | 6,458 | 30,163 | 8,150 | 25,218 | 41,133 | 123,033 | 100.0 | ||
Between July 29 – , there were 400 (0.3%) NIEs used by FAST, Nexus and Travellers whose Nationality was Unknown. Data Source: ContactTrace Desktop Application (This is a live data warehouse and figures are subject to change). |
||||||||||
| Region | Atlantic | Greater Toronto Area | Northern Ontario | Pacific | Prairies | Quebec | Southern Ontario | |||||||
|---|---|---|---|---|---|---|---|---|---|---|---|---|---|---|
| Date | NoTablenote 3 | YesTablenote 4 | No | Yes | No | Yes | No | Yes | No | Yes | No | Yes | No | Yes |
| 09-Aug | 0 | 0 | 0 | 0 | 3 | 12 | 12 | 37 | 0 | 5 | 2 | 14 | 8 | 18 |
| 10-Aug | 2 | 8 | 0 | 0 | 2 | 15 | 5 | 40 | 0 | 3 | 4 | 6 | 11 | 27 |
| 11-Aug | 1 | 19 | 0 | 0 | 2 | 10 | 6 | 56 | 2 | 7 | 1 | 23 | 15 | 53 |
| 12-Aug | 0 | 7 | 0 | 1 | 2 | 18 | 2 | 71 | 0 | 4 | 3 | 44 | 9 | 57 |
| 13-Aug | 6 | 12 | 0 | 0 | 3 | 34 | 10 | 98 | 2 | 9 | 6 | 38 | 19 | 90 |
| 14-Aug | 3 | 8 | 0 | 0 | 1 | 30 | 9 | 131 | 0 | 15 | 4 | 77 | 26 | 94 |
| 15-Aug | 1 | 19 | 0 | 0 | 5 | 21 | 15 | 108 | - | 14 | 2 | 24 | 18 | 80 |
| Total | 13 | 73 | - | 1 | 18 | 140 | 59 | 541 | 4 | 57 | 22 | 226 | 106 | 419 |
| TotalTablenote 5 | 298 | 5,136 | 5 | 373 | 801 | 5,548 | 2562 | 29,377 | 413 | 3,068 | 956 | 9,999 | 9,316 | 37,139 |
| Rate (%) | 5% | 95% | 1% | 99% | 13% | 87% | 8% | 92% | 12% | 88% | 9% | 91% | 20% | 80% |
| Data Source: ContactTrace Desktop Application (This is a live data warehouse and figures are subject to change). | ||||||||||||||
CBSA COVID-19 weekly dashboard
Traveller entry statistics: All modes
Volume summary
All modes
Last week
decrease -4%
8 week
increase 6%
| 2022 | 08-Aug | 09-Aug | 10-Aug | 11-Aug | 12-Aug | 13-Aug | 14-Aug | Total | |
|---|---|---|---|---|---|---|---|---|---|
| All modes | 215,429 | 189,961 | 205,066 | 219,783 | 251,920 | 244,379 | 255,965 | 1,582,503 | |
| CAN CIT | 123,955 | 104,365 | 109,629 | 115,175 | 128,864 | 129,086 | 160,623 | 871,697 | |
| CAN PR | 8,911 | 8,927 | 9,527 | 9,083 | 10,116 | 9,575 | 9,891 | 66,030 | |
| US CIT | 50,407 | 46,263 | 51,873 | 62,972 | 78,239 | 70,714 | 55,352 | 415,820 | |
| Other FN | 32,156 | 30,406 | 34,037 | 32,553 | 34,701 | 35,004 | 30,099 | 228,956 | |
| 2019 | 12-Aug | 13-Aug | 14-Aug | 15-Aug | 16-Aug | 17-Aug | 18-Aug | Total | |
| All modes | 315,877 | 291,340 | 304,404 | 332,497 | 369,640 | 369,000 | 385,278 | 2,368,036 | |
| CAN CIT | 172,692 | 154,218 | 160,479 | 170,974 | 178,619 | 193,771 | 237,289 | 1,268,042 | |
| CAN PR | 9,854 | 9,481 | 9,666 | 9,385 | 10,035 | 10,283 | 12,098 | 70,802 | |
| US CIT | 85,474 | 80,301 | 87,455 | 103,006 | 127,747 | 114,455 | 89,063 | 687,501 | |
| Other FN | 47,857 | 47,340 | 46,804 | 49,132 | 53,239 | 50,491 | 46,828 | 341,691 | |
| % Change | All modes | -32% | -35% | -33% | -34% | -32% | -34% | -34% | -33% |
| CAN CIT | -28% | -32% | -32% | -33% | -28% | -33% | -32% | -31% | |
| CAN PR | -10% | -6% | -1% | -3% | 1% | -7% | -18% | -7% | |
| US CIT | -41% | -42% | -41% | -39% | -39% | -38% | -38% | -40% | |
| Other FN | -33% | -36% | -27% | -34% | -35% | -31% | -36% | -33% |
Long description
| Day 1 | Day 2 | Day 3 | Day 4 | Day 5 | Day 6 | Day 7 | Total | |
|---|---|---|---|---|---|---|---|---|
| All modes | 215,429 | 189,961 | 205,066 | 219,783 | 251,920 | 244,379 | 255,965 | 1,582,503 |
| CAN CIT | 123,955 | 104,365 | 109,629 | 115,175 | 128,864 | 129,086 | 160,623 | 871,697 |
| CAN PR | 8,911 | 8,927 | 9,527 | 9,083 | 10,116 | 9,575 | 9,891 | 66,030 |
| US CIT | 50,407 | 46,263 | 51,873 | 62,972 | 78,239 | 70,714 | 55,352 | 415,820 |
| Other FN | 32,156 | 30,406 | 34,037 | 32,553 | 34,701 | 35,004 | 30,099 | 228,956 |
| Day 1 | Day 2 | Day 3 | Day 4 | Day 5 | Day 6 | Day 7 | Total | |
|---|---|---|---|---|---|---|---|---|
| All modes | 315,877 | 291,340 | 304,404 | 332,497 | 369,640 | 369,000 | 385,278 | 2,368,036 |
| CAN CIT | 172,692 | 154,218 | 160,479 | 170,974 | 178,619 | 193,771 | 237,289 | 1,268,042 |
| CAN PR | 9,854 | 9,481 | 9,666 | 9,385 | 10,035 | 10,283 | 12,098 | 70,802 |
| US CIT | 85,474 | 80,301 | 87,455 | 103,006 | 127,747 | 114,455 | 89,063 | 687,501 |
| Other FN | 47,857 | 47,340 | 46,804 | 49,132 | 53,239 | 50,491 | 46,828 | 341,691 |
| % change on day 1 | % change on day 2 | % change on day 3 | % change on day 4 | % change on day 5 | % change on day 6 | % change on day 7 | Total % change | |
|---|---|---|---|---|---|---|---|---|
| All modes | -32 | -35 | -33 | -34 | -32 | -34 | -34 | -33 |
| CAN CIT | -28 | -32 | -32 | -33 | -28 | -33 | -32 | -31 |
| CAN PR | -10 | -6 | -1 | -3 | 1 | -7 | -18 | -7 |
| US CIT | -41 | -42 | -41 | -39 | -39 | -38 | -38 | -40 |
| Other FN | -33 | -36 | -27 | -34 | -35 | -31 | -36 | -33 |
| Week 26 | Week 27 | Week 28 | Week 29 | Week 30 | Week 31 | Week 32 | Week 33 | |
|---|---|---|---|---|---|---|---|---|
| 2019 | 2,143,864 | 2,409,810 | 2,213,431 | 2,282,806 | 2,314,974 | 2,394,668 | 2,561,130 | 2,368,036 |
| 2020 | 204,549 | 191,731 | 212,008 | 231,744 | 212,215 | 210,891 | 220,194 | 234,911 |
| 2021 | 247,653 | 223,025 | 300,883 | 297,771 | 304,759 | 326,964 | 347,917 | 512,637 |
| 2022 | 1,301,501 | 1,502,233 | 1,446,432 | 1,459,034 | 1,486,515 | 1,542,950 | 1,640,710 | 1,582,503 |
| Mar (%) | Apr (%) | May (%) | Jun (%) | Jul (%) | |
|---|---|---|---|---|---|
| Not-vaccinated | 37.5 | 45.3 | 47.1 | 45.5 | 48.5 |
| Unknown | 62.3 | 54.5 | 52.8 | 54.4 | 51.4 |
| Vaccinated | 0.2 | 0.2 | 0.2 | 0.1 | 0.1 |
| Mar (%) | Apr (%) | May (%) | Jun (%) | Jul (%) | |
|---|---|---|---|---|---|
| Not-vaccinated | 21.7 | 19.5 | 24.8 | 23.0 | 21.0 |
| Unknown | 29.6 | 21.8 | 20.1 | 22.3 | 24.3 |
| Vaccinated | 48.8 | 58.7 | 55.1 | 54.7 | 54.8 |
| Mar (%) | Apr (%) | May (%) | Jun (%) | Jul (%) | |
|---|---|---|---|---|---|
| Not-vaccinated | 1.6 | 2.1 | 2.1 | 2.2 | 1.7 |
| Unknown | 5.5 | 5.4 | 5.9 | 8.5 | 9.2 |
| Vaccinated | 92.9 | 92.5 | 92.0 | 89.3 | 89.1 |
| Mar (%) | Apr (%) | May (%) | Jun (%) | Jul (%) | |
|---|---|---|---|---|---|
| Not-vaccinated | 0.3 | 0.3 | 0.3 | 0.3 | 0.3 |
| Unknown | 4.7 | 4.2 | 4.8 | 5.8 | 6.7 |
| Vaccinated | 95.0 | 95.5 | 95.0 | 93.9 | 93.1 |
Traveller entry statistics: Air mode
Volume summary
Air mode
Last week
decrease -1%
8 week
increase 4%
| 2022 | 08-Aug | 09-Aug | 10-Aug | 11-Aug | 12-Aug | 13-Aug | 14-Aug | Total | |
|---|---|---|---|---|---|---|---|---|---|
| Air | 88,460 | 79,231 | 84,111 | 84,867 | 87,688 | 88,238 | 93,018 | 605,613 | |
| CAN CIT | 47,054 | 41,600 | 41,987 | 42,074 | 45,512 | 47,420 | 55,786 | 321,433 | |
| CAN PR | 3,799 | 3,387 | 3,622 | 3,138 | 3,425 | 3,678 | 4,266 | 25,315 | |
| US CIT | 14,607 | 12,927 | 14,223 | 17,485 | 16,368 | 14,603 | 12,941 | 103,154 | |
| Other FN | 23,000 | 21,317 | 24,279 | 22,170 | 22,383 | 22,537 | 20,025 | 155,711 | |
| 2019 | 12-Aug | 13-Aug | 14-Aug | 15-Aug | 16-Aug | 17-Aug | 18-Aug | Total | |
| Air | 112,012 | 104,536 | 108,087 | 110,651 | 117,659 | 116,022 | 114,823 | 783,790 | |
| CAN CIT | 54,097 | 48,127 | 52,243 | 50,932 | 55,864 | 59,817 | 63,294 | 384,374 | |
| CAN PR | 4,824 | 4,619 | 4,816 | 4,410 | 4,783 | 4,768 | 5,409 | 33,629 | |
| US CIT | 20,215 | 19,126 | 20,149 | 22,709 | 22,849 | 19,093 | 16,087 | 140,228 | |
| Other FN | 32,876 | 32,664 | 30,879 | 32,600 | 34,163 | 32,344 | 30,033 | 225,559 | |
| % Change | Air | -21% | -24% | -22% | -23% | -25% | -24% | -19% | -23% |
| CAN CIT | -13% | -14% | -20% | -17% | -19% | -21% | -12% | -16% | |
| CAN PR | -21% | -27% | -25% | -29% | -28% | -23% | -21% | -25% | |
| US CIT | -28% | -32% | -29% | -23% | -28% | -24% | -20% | -26% | |
| Other FN | -30% | -35% | -21% | -32% | -34% | -30% | -33% | -31% |
Long description
| Day 1 | Day 2 | Day 3 | Day 4 | Day 5 | Day 6 | Day 7 | Total | |
|---|---|---|---|---|---|---|---|---|
| Air | 88,460 | 79,231 | 84,111 | 84,867 | 87,688 | 88,238 | 93,018 | 605,613 |
| CAN CIT | 47,054 | 41,600 | 41,987 | 42,074 | 45,512 | 47,420 | 55,786 | 321,433 |
| CAN PR | 3,799 | 3,387 | 3,622 | 3,138 | 3,425 | 3,678 | 4,266 | 25,315 |
| US CIT | 14,607 | 12,927 | 14,223 | 17,485 | 16,368 | 14,603 | 12,941 | 103,154 |
| Other FN | 23,000 | 21,317 | 24,279 | 22,170 | 22,383 | 22,537 | 20,025 | 155,711 |
| Day 1 | Day 2 | Day 3 | Day 4 | Day 5 | Day 6 | Day 7 | Total | |
|---|---|---|---|---|---|---|---|---|
| Air | 112,012 | 104,536 | 108,087 | 110,651 | 117,659 | 116,022 | 114,823 | 783,790 |
| CAN CIT | 54,097 | 48,127 | 52,243 | 50,932 | 55,864 | 59,817 | 63,294 | 384,374 |
| CAN PR | 4,824 | 4,619 | 4,816 | 4,410 | 4,783 | 4,768 | 5,409 | 33,629 |
| US CIT | 20,215 | 19,126 | 20,149 | 22,709 | 22,849 | 19,093 | 16,087 | 140,228 |
| Other FN | 32,876 | 32,664 | 30,879 | 32,600 | 34,163 | 32,344 | 30,033 | 225,559 |
| % change on day 1 | % change on day 2 | % change on day 3 | % change on day 4 | % change on day 5 | % change on day 6 | % change on day 7 | Total % change | |
|---|---|---|---|---|---|---|---|---|
| Air | -21 | -24 | -22 | -23 | -25 | -24 | -19 | -23 |
| CAN CIT | -13 | -14 | -20 | -17 | -19 | -21 | -12 | -16 |
| CAN PR | -21 | -27 | -25 | -29 | -28 | -23 | -21 | -25 |
| US CIT | -28 | -32 | -29 | -23 | -28 | -24 | -20 | -26 |
| Other FN | -30 | -35 | -21 | -32 | -34 | -30 | -33 | -31 |
| Week 2022-06-26 | Week 2022-07-03 | Week 2022-07-10 | Week 2022-07-17 | Week 2022-07-24 | Week 2022-07-31 | Week 2022-08-07 | Week 2022-08-14 | |
|---|---|---|---|---|---|---|---|---|
| Other FN | 140,996 | 150,060 | 153,587 | 150,956 | 151,430 | 156,174 | 160,431 | 155,711 |
| US Citizen | 119,337 | 129,461 | 110,603 | 113,903 | 113,844 | 115,803 | 109,361 | 103,154 |
| Canadian PR | 20,449 | 21,655 | 21,128 | 22,277 | 23,495 | 23,372 | 24,400 | 25,315 |
| Canadian Citizen | 244,638 | 269,141 | 275,835 | 292,327 | 298,589 | 304,239 | 315,579 | 321,433 |
| Canadian % | 50% | 51% | 53% | 54% | 55% | 55% | 56% | 57% |
Port of entry average processing times: Air mode
| Region | Port | Average Processing Time (seconds) // Pre-Phase 1 Lean () | Average Processing Time (seconds) // Post-Phase 1 Lean () and Pre-Phase 1 () | Average Processing Time (seconds) - Phase 1 (July 5 to ) | Current Processing Time (seconds) - 7-day average | |||||
|---|---|---|---|---|---|---|---|---|---|---|
| PIK | IPIL | PIK | IPIL | PIK | IPIL | PIK | IPIL | RTA | ||
| QUE | Montreal (PET) | 137 | 110 | 137 | 97 | 115 | 90 | 55 | 39 | 171 |
| GTA | Toronto (Pearson - T1) | 50 | 108 | 66 | 100 | 64 | 103 | 47 | 39 | 114 |
| Toronto (Pearson - T3) | 86 | 149 | 92 | 168 | 70 | 129 | 65 | 38 | 125 | |
| PRA | Calgary | 115 | 74 | 117 | 149 | 105 | 217 | 112 | 49 | - |
| PAC | Vancouver | 132 | 64 | 123 | 96 | 103 | 81 | 63 | 21 | 169 |
| Reflects period of time from document scan to release in system. Does not represent the entirety processing time (i.e. fumble time, etc.) | ||||||||||
Traveller entry statistics: Land mode
Volume summary
Land mode
Last week
increase -5%
8 week
increase 7%
| 2022 | 08-Aug | 09-Aug | 10-Aug | 11-Aug | 12-Aug | 13-Aug | 14-Aug | Total | |
|---|---|---|---|---|---|---|---|---|---|
| Land | 124,791 | 109,050 | 119,071 | 132,737 | 161,763 | 153,595 | 160,626 | 961,633 | |
| CAN CIT | 67,517 | 50,496 | 54,520 | 59,600 | 70,740 | 75,938 | 101,282 | 480,093 | |
| CAN PR | 2,741 | 2,054 | 1,985 | 1,885 | 2,364 | 2,956 | 4,255 | 18,240 | |
| US CIT | 32,215 | 29,840 | 34,091 | 41,708 | 58,190 | 53,781 | 40,394 | 290,219 | |
| Other FN | 7,533 | 6,859 | 7,269 | 7,712 | 9,636 | 10,487 | 9,060 | 58,556 | |
| Truck driver | 14,785 | 19,801 | 21,206 | 21,832 | 20,833 | 10,433 | 5,635 | 114,525 | |
| 2019 | 12-Aug | 13-Aug | 14-Aug | 15-Aug | 16-Aug | 17-Aug | 18-Aug | Total | |
| Land | 200,136 | 183,752 | 192,895 | 218,057 | 247,383 | 248,908 | 266,328 | 1,557,459 | |
| CAN CIT | 107,445 | 91,956 | 93,224 | 104,248 | 107,678 | 126,553 | 169,324 | 800,428 | |
| CAN PR | 3,828 | 3,106 | 2,988 | 3,081 | 3,258 | 4,018 | 5,998 | 26,277 | |
| US CIT | 59,775 | 55,901 | 61,888 | 74,760 | 99,236 | 91,760 | 69,898 | 513,218 | |
| Other FN | 13,376 | 12,632 | 13,565 | 14,204 | 16,669 | 16,246 | 15,639 | 102,331 | |
| Truck driver | 15,712 | 20,157 | 21,230 | 21,764 | 20,542 | 10,331 | 5,469 | 115,205 | |
| % Change | Land | -38% | -41% | -38% | -39% | -35% | -38% | -40% | -38% |
| CAN CIT | -37% | -45% | -42% | -43% | -34% | -40% | -40% | -40% | |
| CAN PR | -28% | -34% | -34% | -39% | -27% | -26% | -29% | -31% | |
| US CIT | -46% | -47% | -45% | -44% | -41% | -41% | -42% | -43% | |
| Other FN | -44% | -46% | -46% | -46% | -42% | -35% | -42% | -43% | |
| Truck driver | -6% | -2% | -0% | 0% | 1% | 1% | 3% | -1% |
Long description
| Day 1 | Day 2 | Day 3 | Day 4 | Day 5 | Day 6 | Day 7 | Total | |
|---|---|---|---|---|---|---|---|---|
| Land | 124,791 | 109,050 | 119,071 | 132,737 | 161,763 | 153,595 | 160,626 | 961,633 |
| CAN CIT | 67,517 | 50,496 | 54,520 | 59,600 | 70,740 | 75,938 | 101,282 | 480,093 |
| CAN PR | 2,741 | 2,054 | 1,985 | 1,885 | 2,364 | 2,956 | 4,255 | 18,240 |
| US CIT | 32,215 | 29,840 | 34,091 | 41,708 | 58,190 | 53,781 | 40,394 | 290,219 |
| Other FN | 7,533 | 6,859 | 7,269 | 7,712 | 9,636 | 10,487 | 9,060 | 58,556 |
| Truck driver | 14,785 | 19,801 | 21,206 | 21,832 | 20,833 | 10,433 | 5,635 | 114,525 |
| Day 1 | Day 2 | Day 3 | Day 4 | Day 5 | Day 6 | Day 7 | Total | |
|---|---|---|---|---|---|---|---|---|
| Land | 200,136 | 183,752 | 192,895 | 218,057 | 247,383 | 248,908 | 266,328 | 1,557,459 |
| CAN CIT | 107,445 | 91,956 | 93,224 | 104,248 | 107,678 | 126,553 | 169,324 | 800,428 |
| CAN PR | 3,828 | 3,106 | 2,988 | 3,081 | 3,258 | 4,018 | 5,998 | 26,277 |
| US CIT | 59,775 | 55,901 | 61,888 | 74,760 | 99,236 | 91,760 | 69,898 | 513,218 |
| Other FN | 13,376 | 12,632 | 13,565 | 14,204 | 16,669 | 16,246 | 15,639 | 102,331 |
| Truck driver | 15,712 | 20,157 | 21,230 | 21,764 | 20,542 | 10,331 | 5,469 | 115,205 |
| % change on day 1 | % change on day 2 | % change on day 3 | % change on day 4 | % change on day 5 | % change on day 6 | % change on day 7 | Total % change | |
|---|---|---|---|---|---|---|---|---|
| Land | -38 | -41 | -38 | -39 | -35 | -38 | -40 | -38 |
| CAN CIT | -37 | -45 | -42 | -43 | -34 | -40 | -40 | -40 |
| CAN PR | -28 | -34 | -34 | -39 | -27 | -26 | -29 | -31 |
| US CIT | -46 | -47 | -45 | -44 | -41 | -41 | -42 | -43 |
| Other FN | -44 | -46 | -46 | -46 | -42 | -35 | -42 | -43 |
| Truck driver | -6 | -2 | -0 | 0 | 1 | 1 | 3 | -1 |
| Week 2022-06-26 | Week 2022-07-03 | Week 2022-07-10 | Week 2022-07-17 | Week 2022-07-24 | Week 2022-07-31 | Week 2022-08-07 | Week 2022-08-14 | |
|---|---|---|---|---|---|---|---|---|
| Truck Drivers | 116,373 | 108,801 | 97,167 | 115,022 | 113,911 | 113,026 | 105,402 | 114,525 |
| Other FN | 38,505 | 57,507 | 46,828 | 45,845 | 50,177 | 52,394 | 58,029 | 58,556 |
| US Citizen | 248,209 | 322,840 | 271,710 | 267,504 | 280,803 | 290,017 | 289,787 | 290,219 |
| Canadian PR | 14,549 | 18,442 | 18,646 | 16,343 | 16,609 | 17,353 | 21,532 | 18,240 |
| Canadian Citizen | 348,598 | 411,381 | 439,052 | 421,876 | 424,796 | 456,066 | 540,244 | 480,093 |
| Canadian % | 56% | 53% | 59% | 58% | 57% | 58% | 62% | 59% |
| Highway mode | 08-Aug | 09-Aug | 10-Aug | 11-Aug | 12-Aug | 13-Aug | 14-Aug | 7 day total | |
|---|---|---|---|---|---|---|---|---|---|
| Atlantic | Canadian Citizen | 3,453 | 3,035 | 3,130 | 3,422 | 4,182 | 3,522 | 3,921 | 24,665 |
| Canadian PR | 114 | 85 | 130 | 112 | 153 | 89 | 86 | 769 | |
| Foreign National | 2,374 | 2,090 | 2,368 | 2,452 | 2,855 | 3,063 | 2,249 | 17,451 | |
| Total | 5,941 | 5,210 | 5,628 | 5,986 | 7,190 | 6,674 | 6,256 | 42,885 | |
| Quebec | Canadian Citizen | 11,771 | 8,646 | 10,572 | 12,172 | 16,390 | 16,281 | 22,222 | 98,054 |
| Canadian PR | 323 | 273 | 291 | 271 | 347 | 335 | 526 | 2,366 | |
| Foreign National | 5,521 | 4,793 | 5,535 | 7,181 | 10,250 | 7,946 | 6,975 | 48,201 | |
| Total | 17,615 | 13,712 | 16,398 | 19,624 | 26,987 | 24,562 | 29,723 | 148,621 | |
| Northern Ontario | Canadian Citizen | 8,877 | 7,509 | 8,253 | 8,608 | 9,795 | 9,872 | 12,032 | 64,946 |
| Canadian PR | 252 | 299 | 248 | 230 | 288 | 196 | 265 | 1,778 | |
| Foreign National | 4,203 | 3,782 | 4,249 | 5,347 | 7,333 | 6,973 | 4,277 | 36,164 | |
| Total | 13,332 | 11,590 | 12,750 | 14,185 | 17,416 | 17,041 | 16,574 | 102,888 | |
| Southern Ontario |
Canadian Citizen | 27,989 | 24,135 | 25,799 | 28,678 | 32,043 | 28,064 | 33,592 | 200,300 |
| Canadian PR | 2,710 | 3,429 | 3,669 | 3,705 | 4,094 | 3,291 | 2,658 | 23,556 | |
| Foreign National | 19,273 | 18,926 | 22,066 | 25,473 | 33,839 | 30,435 | 23,795 | 173,807 | |
| Total | 49,972 | 46,490 | 51,534 | 57,856 | 69,976 | 61,790 | 60,045 | 397,663 | |
| Prairie | Canadian Citizen | 6,564 | 4,372 | 4,559 | 4,509 | 4,846 | 4,932 | 6,359 | 36,141 |
| Canadian PR | 334 | 422 | 527 | 569 | 641 | 624 | 477 | 3,594 | |
| Foreign National | 2,194 | 2,021 | 2,298 | 2,525 | 2,813 | 2,185 | 1,819 | 15,855 | |
| Total | 9,092 | 6,815 | 7,384 | 7,603 | 8,300 | 7,741 | 8,655 | 55,590 | |
| Pacific | Canadian Citizen | 17,650 | 14,650 | 14,769 | 15,190 | 15,589 | 18,439 | 25,844 | 122,131 |
| Canadian PR | 1,356 | 1,015 | 1,033 | 1,050 | 1,150 | 1,338 | 1,588 | 8,530 | |
| Foreign National | 9,833 | 9,568 | 9,575 | 11,243 | 15,155 | 16,010 | 11,941 | 83,325 | |
| Total | 28,839 | 25,233 | 25,377 | 27,483 | 31,894 | 35,787 | 39,373 | 213,986 | |
| Overall total | 124,791 | 109,050 | 119,071 | 132,737 | 161,763 | 153,595 | 160,626 | 961,633 | |
Port of entry average processing times: Land mode
| Region | Port | Average Processing Time (seconds) // Pre-Phase 1 Lean ) | Average Processing Time (seconds) // Post-Phase 1 Lean () & Pre-Phase 1 () | Average Processing Time (seconds) - Phase 1 (July 5 – ) | Current Processing Time (seconds) - 7-day average |
|---|---|---|---|---|---|
| ATL | St Stephen | 95 | 126 | 205 | 54 |
| St Stephen 3rd Bridge | 196 | 203 | 219 | 67 | |
| Woodstock Road | 308 | 287 | 292 | 81 | |
| QUE | St-Armand/Philipsburg | 167 | 145 | 171 | 53 |
| St-Bernard-de-Lacolle | 289 | 255 | 267 | 49 | |
| NOR | Cornwall | 31 | 32 | 16 | 28 |
| Prescott | 133 | 136 | 150 | 55 | |
| Thousand Islands Bridge | 238 | 221 | 207 | 64 | |
| Sault Ste. Marie | 64 | 64 | 109 | 36 | |
| Fort Frances Bridge | 144 | 146 | 197 | 73 | |
| SOR | Queenston-Lewiston Bridge | 151 | 150 | 167 | 41 |
| Rainbow Bridge | 182 | 173 | 187 | 51 | |
| Peace Bridge | 154 | 134 | 157 | 53 | |
| Blue Water Bridge | 156 | 147 | 163 | 55 | |
| Windsor/Detroit Tunnel | 53 | 46 | 76 | 37 | |
| Ambassador Bridge | 73 | 68 | 111 | 65 | |
| PRA | Emerson | 277 | 302 | 285 | 83 |
| North Portal | 162 | 159 | 282 | 148 | |
| Coutts | 234 | 226 | 234 | 84 | |
| PAC | Abbotsford-Huntingdon | 241 | 221 | 215 | 63 |
| Aldergrove | 118 | 105 | 153 | 53 | |
| Pacific Highway | 146 | 130 | 164 | 40 | |
| Douglas (Peace Arch) | 160 | 158 | 184 | 49 | |
| Reflects period of time from document scan to release in system. Does not represent the entirety processing time (i.e. fumble time, etc.) | |||||
Traveller entry statistics: Marine mode
Volume summary
Marine mode
Last week
decrease -5%
8 week
increase 14%
| 2022 | 08-Aug | 09-Aug | 10-Aug | 11-Aug | 12-Aug | 13-Aug | 14-Aug | Total | |
|---|---|---|---|---|---|---|---|---|---|
| Marine | 2,085 | 1,610 | 1,830 | 2,090 | 2,417 | 2,483 | 2,272 | 14,787 | |
| CAN CIT | 568 | 398 | 553 | 502 | 489 | 538 | 855 | 3,903 | |
| CAN PR | 23 | 15 | 4 | 7 | 17 | 23 | 25 | 114 | |
| US CIT | 1,248 | 1,035 | 1,090 | 1,370 | 1,701 | 1,636 | 1,250 | 9,330 | |
| Other FN | 246 | 162 | 183 | 211 | 210 | 286 | 142 | 1,440 | |
| 2019 | 12-Aug | 13-Aug | 14-Aug | 15-Aug | 16-Aug | 17-Aug | 18-Aug | Total | |
| Marine | 3,188 | 2,601 | 2,893 | 3,329 | 4,137 | 3,649 | 3,559 | 23,356 | |
| CAN CIT | 793 | 625 | 763 | 1,004 | 891 | 837 | 1,404 | 6,317 | |
| CAN PR | 23 | 29 | 19 | 22 | 21 | 22 | 34 | 170 | |
| US CIT | 2,031 | 1,698 | 1,779 | 1,965 | 2,808 | 2,438 | 1,758 | 14,477 | |
| Other FN | 341 | 249 | 332 | 338 | 417 | 352 | 363 | 2,392 | |
| % Change | Marine | -35% | -38% | -37% | -37% | -42% | -32% | -36% | -37% |
| CAN CIT | -28% | -36% | -28% | -50% | -45% | -36% | -39% | -38% | |
| CAN PR | 0% | -48% | -79% | -68% | -19% | 5% | -26% | -33% | |
| US CIT | -39% | -39% | -39% | -30% | -39% | -33% | -29% | -36% | |
| Other FN | -28% | -35% | -45% | -38% | -50% | -19% | -61% | -40% | |
| Data does not include pleasure craft passages reported to the Telephone Reporting Centre. | |||||||||
Long description
| Day 1 | Day 2 | Day 3 | Day 4 | Day 5 | Day 6 | Day 7 | Total | |
|---|---|---|---|---|---|---|---|---|
| Marine | 2,085 | 1,610 | 1,830 | 2,090 | 2,417 | 2,483 | 2,272 | 14,787 |
| CAN CIT | 568 | 398 | 553 | 502 | 489 | 538 | 855 | 3,903 |
| CAN PR | 23 | 15 | 4 | 7 | 17 | 23 | 25 | 114 |
| US CIT | 1,248 | 1,035 | 1,090 | 1,370 | 1,701 | 1,636 | 1,250 | 9,330 |
| Other FN | 246 | 162 | 183 | 211 | 210 | 286 | 142 | 1,440 |
| Day 1 | Day 2 | Day 3 | Day 4 | Day 5 | Day 6 | Day 7 | Total | |
|---|---|---|---|---|---|---|---|---|
| Marine | 3,188 | 2,601 | 2,893 | 3,329 | 4,137 | 3,649 | 3,559 | 23,356 |
| CAN CIT | 793 | 625 | 763 | 1,004 | 891 | 837 | 1,404 | 6,317 |
| CAN PR | 23 | 29 | 19 | 22 | 21 | 22 | 34 | 170 |
| US CIT | 2,031 | 1,698 | 1,779 | 1,965 | 2,808 | 2,438 | 1,758 | 14,477 |
| Other FN | 341 | 249 | 332 | 338 | 417 | 352 | 363 | 2,392 |
| % change on day 1 | % change on day 2 | % change on day 3 | % change on day 4 | % change on day 5 | % change on day 6 | % change on day 7 | Total % change | |
|---|---|---|---|---|---|---|---|---|
| Marine | -35 | -38 | -37 | -37 | -42 | -32 | -36 | -37 |
| CAN CIT | -28 | -36 | -28 | -50 | -45 | -36 | -39 | -38 |
| CAN PR | 0 | -48 | -79 | -68 | -19 | 5 | -26 | -33 |
| US CIT | -39 | -39 | -39 | -30 | -39 | -33 | -29 | -36 |
| Other FN | -28 | -35 | -45 | -38 | -50 | -19 | -61 | -40 |
| Week 2022-06-26 | Week 2022-07-03 | Week 2022-07-10 | Week 2022-07-17 | Week 2022-07-24 | Week 2022-07-31 | Week 2022-08-07 | Week 2022-08-14 | |
|---|---|---|---|---|---|---|---|---|
| Other FN | 635 | 1,008 | 960 | 1,052 | 1,173 | 1,157 | 1,187 | 1,440 |
| US Citizen | 6,859 | 8,322 | 6,877 | 7,930 | 8,331 | 9,074 | 9,566 | 9,330 |
| Canadian PR | 86 | 116 | 116 | 96 | 103 | 113 | 118 | 114 |
| Canadian Citizen | 2,267 | 3,372 | 3,680 | 3,691 | 2,955 | 3,808 | 4,705 | 3,903 |
| Canadian % | 24% | 27% | 33% | 30% | 24% | 28% | 31% | 27% |
| 2022-06-20 to 2022-06-26 (%) |
2022-06-27 to 2022-07-03 (%) |
2022-07-04 to 2022-07-10 (%) |
2022-07-11 to 2022-07-17 (%) |
2022-07-18 to 2022-07-24 (%) |
2022-07-25 to 2022-07-31 (%) |
2022-08-01 to 2022-08-07 (%) |
2022-08-08 to 2022-08-14 (%) |
|
|---|---|---|---|---|---|---|---|---|
| Foreign Worker | 87.90 | 87.34 | 87.84 | 87.02 | 86.38 | 86.43 | 86.52 | 85.17 |
| Family Reunification | 86.32 | 86.21 | 85.53 | 85.30 | 84.65 | 84.90 | 85.62 | 85.30 |
| Compassionate Entry | 81.97 | 82.39 | 79.11 | 78.64 | 83.03 | 80.63 | 83.81 | 79.19 |
| Study (International Student) | 90.57 | 87.71 | 88.45 | 88.55 | 87.04 | 85.78 | 85.72 | 87.62 |
Traveller Processing: Referrals
| 2022-06-20 to 2022-06-26 (%) |
2022-06-27 to 2022-07-03 (%) |
2022-07-04 to 2022-07-10 (%) |
2022-07-11 to 2022-07-17 (%) |
2022-07-18 to 2022-07-24 (%) |
2022-07-25 to 2022-07-31 (%) |
2022-08-01 to 2022-08-07 (%) |
2022-08-08 to 2022-08-14 (%) |
|
|---|---|---|---|---|---|---|---|---|
| Air | 0.0000 | 0.0000 | 0.0000 | 0.0002 | 0.0000 | 0.0002 | 0.0009 | 0.0000 |
| 2022-06-20 to 2022-06-26 (%) |
2022-06-27 to 2022-07-03 (%) |
2022-07-04 to 2022-07-10 (%) |
2022-07-11 to 2022-07-17 (%) |
2022-07-18 to 2022-07-24 (%) |
2022-07-25 to 2022-07-31 (%) |
2022-08-01 to 2022-08-07 (%) |
2022-08-08 to 2022-08-14 (%) |
|
|---|---|---|---|---|---|---|---|---|
| Land | 0.0331 | 0.0221 | 0.0386 | 0.0242 | 0.0261 | 0.0153 | 0.0297 | 0.0290 |
| 2022-06-06 to 2022-06-12 (%) |
2022-06-13 to 2022-06-19 (%) |
2022-06-20 to 2022-06-26 (%) |
2022-06-27 to 2022-07-03 (%) |
2022-07-04 to 2022-07-10 (%) |
2022-07-11 to 2022-07-17 (%) |
2022-07-18 to 2022-07-24 (%) |
2022-07-25 to 2022-07-31 (%) |
2022-08-01 to 2022-08-07 (%) |
2022-08-08 to 2022-08-14 (%) |
|
|---|---|---|---|---|---|---|---|---|---|---|
| Air | 0.0000 | 0.0000 | 0.0000 | 0.0000 | 0.0000 | 0.0002 | 0.0000 | 0.0002 | 0.0009 | 0.0000 |
| Land | 0.02 | 0.05 | 0.05 | 0.03 | 0.05 | 0.03 | 0.03 | 0.02 | 0.03 | 0.03 |
| Total | 0.01 | 0.03 | 0.03 | 0.02 | 0.03 | 0.02 | 0.02 | 0.01 | 0.02 | 0.02 |
ArriveCAN usage
| All modes | 26,023,762 (+864,314) |
|---|---|
| Air | 13,893,830 (+379,136) |
| Land | 11,994,673 (+474,253) |
| Marine | 134,110 (+10,822) |
| Rail | 182 (+19) |
| Unknown | 967 (+84) |
| All modes | 38,744,502 (+1,418,106) |
|---|---|
| Air | 19,206,686 (+578,982) |
| Land | 19,296,398 (+818,944) |
| Marine | 240,074 (+20,072) |
| Rail | 196 (21) |
| Unknown | 1,148 (+87) |
| Nov-21 | Dec-21 | Jan-22 | Feb-22 | Mar-22 | Apr-22 | May-22 | Jun-22 | Jul-22 | |
|---|---|---|---|---|---|---|---|---|---|
| All | 990,270 | 1,286,568 | 649,057 | 673,862 | 1,142,632 | 1,440,158 | 1,659,096 | 1,801,757 | 2,022,146 |
| Apple | 345,664 | 837,665 | 400,474 | 432,856 | 737,430 | 905,852 | 1,064,693 | 1,207,945 | 1,375,909 |
| Android | 644,606 | 448,903 | 248,583 | 241,006 | 405,202 | 534,306 | 594,403 | 593,812 | 646,237 |
| 2022-06-20 to 2022-06-26 (%) |
2022-06-27 to 2022-07-03 (%) |
2022-07-04 to 2022-07-10 (%) |
2022-07-11 to 2022-07-17 (%) |
2022-07-18 to 2022-07-24 (%) |
2022-07-25 to 2022-07-31 (%) |
2022-08-01 to 2022-08-07 (%) |
2022-08-08 to 2022-08-14 (%) |
|
|---|---|---|---|---|---|---|---|---|
| Air | 95.50 | 99.52 | 99.47 | 99.53 | 99.57 | 99.63 | 99.61 | 99.64 |
| 2022-06-20 to 2022-06-26 (%) |
2022-06-27 to 2022-07-03 (%) |
2022-07-04 to 2022-07-10 (%) |
2022-07-11 to 2022-07-17 (%) |
2022-07-18 to 2022-07-24 (%) |
2022-07-25 to 2022-07-31 (%) |
2022-08-01 to 2022-08-07 (%) |
2022-08-08 to 2022-08-14 (%) |
|
|---|---|---|---|---|---|---|---|---|
| Land | 90.11 | 89.49 | 88.97 | 90.09 | 90.39 | 90.50 | 90.37 | 90.27 |
Situational report for commercial trucks: Land mode
Volume summary
Commercial trucks
Last week
increase 9%
8 week
increase 4%
| Total | ||||||||
| 2019 Truck drivers | 15,712 | 20,157 | 21,230 | 21,764 | 20,542 | 10,331 | 5,469 | 115,205 |
| 2020 Truck drivers | 14,824 | 19,488 | 20,462 | 20,735 | 19,990 | 10,017 | 5,299 | 110,815 |
| 2021 Truck drivers | 14,947 | 19,694 | 21,238 | 21,162 | 20,416 | 10,887 | 5,505 | 113,849 |
| 2022 Truck drivers | 14,785 | 19,801 | 21,206 | 21,832 | 20,833 | 10,433 | 5,635 | 114,525 |
| % change from 2019 to 2022 | -5.90% | -1.77% | -0.11% | 0.31% | 1.42% | 0.99% | 3.04% | -0.59% |
| % change from 2020 to 2022 | -0.26% | 1.61% | 3.64% | 5.29% | 4.22% | 4.15% | 6.34% | 3.35% |
| % change from 2021 to 2022 | -1.08% | 0.54% | -0.15% | 3.17% | 2.04% | -4.17% | 2.36% | 0.59% |
| 2019 Truck conveyances | 15,113 | 19,223 | 20,014 | 20,477 | 19,279 | 9,135 | 4,607 | 107,848 |
| 2020 Truck conveyances | 14,117 | 18,475 | 19,252 | 19,441 | 18,564 | 8,853 | 4,579 | 103,281 |
| 2021 Truck conveyances | 14,230 | 18,700 | 19,925 | 19,802 | 19,059 | 9,543 | 4,700 | 105,959 |
| 2022 Truck conveyances | 14,001 | 18,648 | 19,700 | 20,216 | 19,196 | 8,956 | 4,639 | 105,356 |
| % change from 2019 to 2022 | -7.36% | -2.99% | -1.57% | -1.27% | -0.43% | -1.96% | 0.69% | -2.31% |
| % change from 2020 to 2022 | -0.82% | 0.94% | 2.33% | 3.99% | 3.40% | 1.16% | 1.31% | 2.01% |
| % change from 2021 to 2022 | -1.61% | -0.28% | -1.13% | 2.09% | 0.72% | -6.15% | -1.30% | -0.57% |
Long description
| Truck drivers 2019 to 2022 | Day 1 | Day 2 | Day 3 | Day 4 | Day 5 | Day 6 | Day 7 | Total truck drivers |
| 2019 (Aug 12 to 18) | 15,712 | 20,157 | 21,230 | 21,764 | 20,542 | 10,331 | 5,469 | 115,205 |
| 2020 (Aug 10 to 16) | 14,824 | 19,488 | 20,462 | 20,735 | 19,990 | 10,017 | 5,299 | 110,815 |
| 2021 (Aug 09 to 15) | 14,947 | 19,694 | 21,238 | 21,162 | 20,416 | 10,887 | 5,505 | 113,849 |
| 2022 (Aug 08 to 14) | 14,785 | 19,801 | 21,206 | 21,832 | 20,833 | 10,433 | 5,635 | 114,525 |
| Span | % change on day 1 | % change on day 2 | % change on day 3 | % change on day 4 | % change on day 5 | % change on day 6 | % change on day 7 | Total % change |
| 2019 to 2022 | -5.90 | -1.77 | -0.11 | 0.31 | 1.42 | 0.99 | 3.04 | -0.59 |
| 2020 to 2022 | -0.26 | 1.61 | 3.64 | 5.29 | 4.22 | 4.15 | 6.34 | 3.35 |
| 2021 to 2022 | -1.08 | 0.54 | -0.15 | 3.17 | 2.04 | -4.17 | 2.36 | 0.59 |
| Truck conveyances 2019 to 2022 | Day 1 | Day 2 | Day 3 | Day 4 | Day 5 | Day 6 | Day 7 | Total truck conveyances |
| 2019 (Aug 12 to 18) | 15,113 | 19,223 | 20,014 | 20,477 | 19,279 | 9,135 | 4,607 | 107,848 |
| 2020 (Aug 10 to 16) | 14,117 | 18,475 | 19,252 | 19,441 | 18,564 | 8,853 | 4,579 | 103,281 |
| 2021 (Aug 09 to 15) | 14,230 | 18,700 | 19,925 | 19,802 | 19,059 | 9,543 | 4,700 | 105,959 |
| 2022 (Aug 08 to 14) | 14,001 | 18,648 | 19,700 | 20,216 | 19,196 | 8,956 | 4,639 | 105,356 |
| Span | % change on day 1 | % change on day 2 | % change on day 3 | % change on day 4 | % change on day 5 | % change on day 6 | % change on day 7 | Total % change |
| 2019 to 2022 | -7.36 | -2.99 | -1.57 | -1.27 | -0.43 | -1.96 | 0.69 | -2.31 |
| 2020 to 2022 | -0.82 | 0.94 | 2.33 | 3.99 | 3.40 | 1.16 | 1.31 | 2.01 |
| 2021 to 2022 | -1.61 | -0.28 | -1.13 | 2.09 | 0.72 | -6.15 | -1.30 | -0.57 |
| Week 2022-06-26 | Week 2022-07-03 | Week 2022-07-10 | Week 2022-07-17 | Week 2022-07-24 | Week 2022-07-31 | Week 2022-08-07 | Week 2022-08-14 | |
|---|---|---|---|---|---|---|---|---|
| Other FN | 13,275 | 12,670 | 10,812 | 13,052 | 12,900 | 13,361 | 12,678 | 13,154 |
| US Citizen | 12,544 | 11,620 | 10,601 | 12,369 | 12,717 | 12,311 | 11,760 | 12,874 |
| Canadian PR | 21,667 | 20,773 | 18,500 | 22,119 | 21,325 | 22,048 | 21,025 | 22,353 |
| Canadian Citizen | 68,887 | 63,738 | 57,254 | 67,482 | 66,969 | 65,306 | 59,939 | 66,144 |
| Canadian % | 78% | 78% | 78% | 78% | 78% | 77% | 77% | 77% |
Page details
- Date modified: