
Departmental Plan (2023 to 2024): Spending and corporate information
Planned spending and human resources
This section provides an overview of the CBSA's planned spending and human resources for the next three fiscal years, and compares planned spending for to with spending for the last three fiscal years.
Planned spending
Departmental spending from to through to
The following graph shows trends in the CBSA's spending over time.
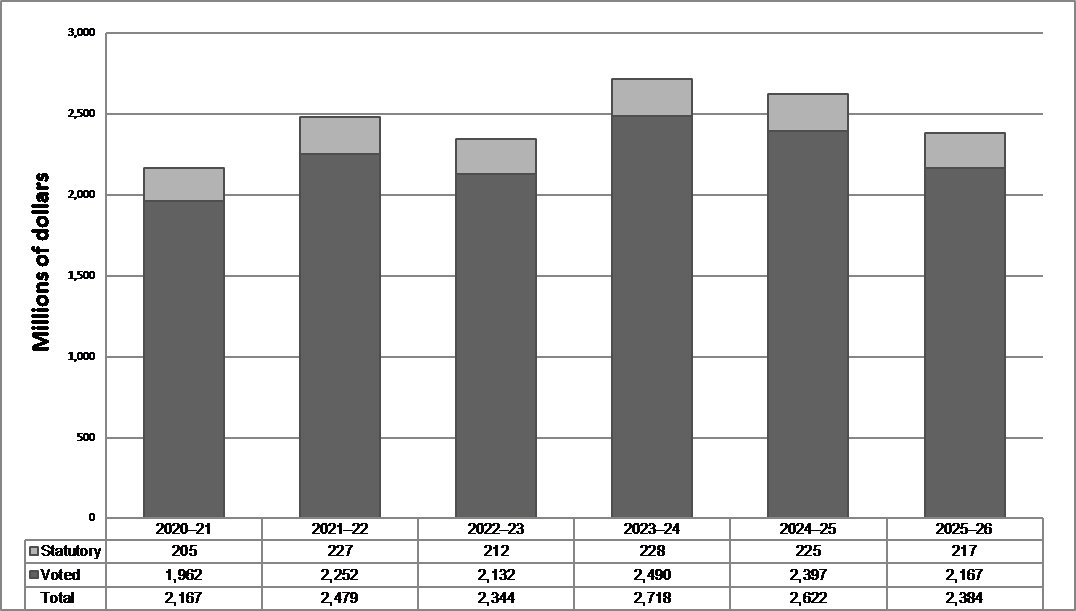
It should be noted that amounts may not exactly add up due to rounding.
Table format for trends in the CBSA's actual and planned spending from to through to
(in millions of dollars)
| to | to | to | to | to | to | |
|---|---|---|---|---|---|---|
| Statutory | $205 | $227 | $212 | $228 | $225 | $217 |
| Voted | $1,962 | $2,252 | $2,132 | $2,490 | $2,397 | $2,167 |
| Total | $2,167 | $2,479 | $2,344 | $2,718 | $2,622 | $2,384 |
Budgetary planning summary for core responsibilities and internal services
The following table shows information on spending for each of the CBSA's core responsibilities, as well as its internal services, for to and other relevant fiscal years.
| Core responsibilities and internal services |
to actual expenditures |
to actual expenditures |
to forecast spending |
to budgetary spending (as indicated in Main Estimates) |
to planned spending |
to planned spending |
to planned spending |
|---|---|---|---|---|---|---|---|
| Border management | 1,452,822,132 | 1,665,443,159 | 1,619,861,283 | 1,765,249,471 | 1,765,249,471 | 1,806,844,795 | 1,622,896,427 |
| Border enforcement | 251,133,356 | 303,098,988 | 318,963,184 | 445,531,244 | 445,531,244 | 342,337,543 | 336,210,665 |
| Subtotal | 1,703,955,488 | 1,968,542,147 | 1,938,824,467 | 2,210,780,715 | 2,210,780,716 | 2,149,182,338 | 1,959,107,092 |
| Internal services | 463,482,360 | 510,175,844 | 405,261,439 | 507,087,682 | 507,087,682 | 472,675,940 | 424,903,107 |
| Total | 2,167,437,848 | 2,478,717,991 | 2,344,085,906 | 2,717,868,397 | 2,717,868,397 | 2,621,858,278 | 2,384,010,199 |
Forecast spending for to is slightly lower than actual expenditures in to . This difference is mainly attributed to re-profiled funding from to into future years, such as:
- re-profiled funding for Asylum Irregular Migration as well as the Asylum Interoperability Project
- re-profiled funding for the Drug-Impaired Driving Initiative
- re-profiled funding for the Gordie Howe International Bridge Project
- re-profiled funding for the Integrated Cargo Security Initiative – Marine Container Examination Facilities Project
- re-profiled funding for the Buildings and Equipment Program
In to , the Agency has an increase of $373.8 million in funding over the forecast spending in to due to new and sunsetting funding. New funding includes:
- funding for Canada's Asylum Irregular Migration System
- funding for the Gordie Howe International Bridge Project
- funding for the resettlement of Afghan refugees
- funding for national guard contracts
- funding for irregular migration in the Americas
- funding for the Land Border Crossing Project
Budgetary gross and net planned spending summary
The following table reconciles gross planned spending with net planned spending for to .
| Core responsibilities and
internal services |
to gross planned spending |
to planned revenues netted against spending |
to planned net spending |
|---|---|---|---|
| Border management | 1,789,279,471 | (24,030,000) | 1,765,249,471 |
| Border enforcement | 445,531,244 | 0 | 445,531,244 |
| Subtotal | 2,234,810,715 | (24,030,000) | 2,210,780,715 |
| Internal services | 507,087,682 | 0 | 507,087,682 |
| Total | 2,741,898,397 | (24,030,000) | 2,717,868,397 |
The purpose of this table is to help present the full scope of the Agency's operations that are materially funded through revenues or special purpose accounts.
Planned human resources
The following table shows information on human resources, in full-time equivalents (FTEs), for each of the CBSA's core responsibilities, as well as its internal services, for to and other relevant fiscal years.
| Core responsibilities and internal services | to actual full-time equivalents |
to actual full-time equivalents |
to forecast full-time equivalents |
to planned full-time equivalents |
to planned full-time equivalents |
to planned full-time equivalents |
|---|---|---|---|---|---|---|
| Border management | 10,023 | 10,210 | 11,476 | 11,502 | 11,594 | 11,322 |
| Border enforcement | 1,647 | 1,735 | 1,953 | 1,892 | 1,902 | 1,888 |
| Subtotal | 11,670 | 11,945 | 13,429 | 13,394 | 13,496 | 13,210 |
| Internal services | 2,726 | 3,112 | 2,367 | 2,418 | 2,441 | 2,355 |
| Total | 14,396 | 15,057 | 15,796 | 15,812 | 15,937 | 15,565 |
In to , the Agency's planned FTEs are expected to increase due to new funding related to Canada's Asylum Irregular Migration System; the Gordie Howe International Bridge Project; the resettlement of Afghan refugees; national guard contracts; and irregular migration in the Americas.
Estimates by vote
Get information on the CBSA's organizational appropriations in the to Main Estimates.
Future-oriented condensed statement of operations
The future-oriented condensed statement of operations provides an overview of the CBSA's operations for to through to .
The forecast and planned amounts in this statement of operations were prepared on an accrual basis. The forecast and planned amounts presented in other sections of the Departmental Plan were prepared on an expenditure basis. Amounts may therefore differ.
Here is a more detailed future-oriented statement of operations and associated notes, including a reconciliation of the net cost of operations with the requested authorities.
| Financial information | to forecast results |
to planned results |
Difference ( to planned results minus to forecast results) |
|---|---|---|---|
| Total expenses | 2,644,861,000 | 2,808,719,000 | 163,858,000 |
| Total revenues | 24,030,000 | 24,030,000 | 0 |
| Net cost of operations before government funding and transfers | 2,620,831,000 | 2,784,689,000 | 163,858,000 |
The total expenses in to are projected to be $2,809 million, representing an increase of $164 million compared to the $2,645 million forecast in to .
Corporate information
Organizational profile
- Appropriate minister: The Honourable Marco E. L. Mendicino, P.C., M.P.
- Institutional head: Erin O'Gorman
- Ministerial portfolio: Public Safety
- Enabling instruments: Canada Border Services Agency Act
Department of Public Safety and Emergency Preparedness Act - Year of incorporation/commencement:
Raison d'être, mandate and role: who we are and what we do
Information on the CBSA's raison d'être, mandate and role is available on its website.
Information on the CBSA's mandate letter commitments is available in the Minister's mandate letter.
Operating context
For information on the CBSA's operating context, please refer to the “Plans at glance” section of this document.
Reporting framework
The CBSA's approved Departmental Results Framework and Program Inventory for to are shown below:
Core responsibility: Border management
Departmental result 1: The CBSA’s intelligence, threat and risk assessment activities contribute to the identification, mitigation and neutralization of risks and threats to the safety, security, and prosperity of Canadians and Canada
Related departmental results indicators 1:
- percentage of air travellers targeted for examination that led to an intended result
- percentage of marine and air cargo targeted for examination that led to an intended result
- percentage of recommendations for admissibility provided/completed within relevant service standards
Departmental result 2: Admissible travellers are processed in an efficient manner
Related departmental results indicators 2:
- percentage of time the CBSA is meeting the Highway Border Wait Time (BWT) Service Standard
- percentage of travellers using Primary Inspection Devices (PID) at PID-enabled airports
- actual availability of Primary Inspection Devices as a percentage of planned availability
Departmental result 3: Travellers and their goods are compliant with applicable legislation
Related departmental results indicators 3:
- percentage of traveller immigration examinations that produced a result (enforcement or facilitation action)
- traveller goods selective examination resultant rate is 'X' times higher than the traveller goods random examination resultant rate
Departmental result 4: Admissible commercial goods and conveyances are processed in an efficient manner
Related departmental results indicators 4:
- percentage of time the CBSA met the commercial Highway Border Wait Time Service Standard
- percentage of eligible release decisions provided within established timeframes
- actual availability of Single Windows as a percentage of planned availability
Departmental result 5: Traders are compliant with applicable legislation and requirements
Related departmental results indicators 5:
- percentage of high-risk commercial goods targeted by the National Targeting Centre (NTC) that are examined at the border
- percentage of random commercial examinations that produced a result
- percentage of commercial examinations that produce a result related to non-compliance against a trader
- percentage of penalties applied against traders representing continued non-compliance
Departmental result 6: Importers comply with revenue requirements
Related departmental results indicators 6:
- percentage of importers not compliant with revenue requirements
- Return on investment (ROI) for compliance activities related to revenue requirements
Departmental result 7: Canadian producers are protected from unfairly dumped and subsidized imports
Related departmental results indicators 7:
- percentage of imports potentially subject to anti-dumping or countervailing duties verified to ensure compliance
Departmental result 8: Trusted Traveller and Trader programs increase processing efficiency of low-risk, pre-approved travellers and traders
Related departmental results indicators 8:
- percentage of time the CBSA is meeting the NEXUS Highway Border Wait Time (BWT) Service Standard
- percentage of kiosk processing time saving per trusted traveller passage at NEXUS air ports of entry
- percentage of active members who are compliant with program requirements and border legislation
- ratio of conventional traders and their goods that are examined at the border compared to Trusted Traders and their goods
- percentage of trade by value of goods imported into Canada by participants in the CBSA's Trusted Trader programs
Departmental result 9: Travellers and the business community have access to timely redress mechanisms
Related departmental results indicators 9:
- percentage of trade appeals received that are decided within established service standards
- percentage of enforcement appeals received that are decided within established service standards
Program inventory: Border management
- Targeting
- Intelligence collection and analysis
- Security screening
- Traveller facilitation and compliance
- Commercial facilitation and compliance
- Trade facilitation and compliance
- Anti-dumping and countervailing
- Trusted traveller
- Trusted trader
- Recourse
- Force generation
- Buildings and equipment
- Field technology support
Core responsibility: Border enforcement
Departmental result 1:: Immigration investigations identify persons inadmissible to Canada
Related departmental results indicator 1:
- percentage of immigration investigations concluded that result in a person being identified as inadmissible to Canada
Departmental result 2: Persons are placed on alternatives to detention whenever possible, or placed in the most appropriate detention facility according to their risk profile
Related departmental results indicators 2:
- persons released from detention on alternatives to detention as a percentage of all persons detained
- percentage of individuals detained in appropriate facilities based on their assessed risk profile
Departmental result 3: The Minister’s positions are appropriately represented in immigration and refugee decision-making processes
Related departmental results indicators 3:
- percentage of admissibility hearings, detention reviews and appeals where the Minister’s position is upheld by the Immigration Division and the Immigration Appeal Division
- percentage of refugee hearings where the Minister’s position is upheld by the Refugee Protection Division and the Refugee Appeal Division
Departmental result 4: Inadmissible foreign nationals are prioritized and removed expeditiously from Canada
Related departmental results indicators 4:
- percentage of high-priority foreign nationals removed (i.e., on grounds of serious inadmissibility such as criminality, war crimes, security)
- percentage of removals with no known impediments
Departmental result 5: People and businesses that are referred to Crown counsel for prosecution are convicted
Related departmental results indicator 5:
- referrals for prosecution accepted by the Public Prosecution Service of Canada (PPSC) as a percentage of all referrals made to PPSC
- percentage of prosecutions concluded that result in a conviction
Program inventory: Border enforcement
- Immigration investigations
- Detentions
- Hearings
- Removals
- Criminal investigations
It should be noted that, as of to , the CBSA's program inventory now contains 2 distinct programs (Commercial Facilitation and Compliance; Trade Facilitation and Compliance) instead of the combined program (Commercial-Trade Facilitation and Compliance) that was reported in past years.
Supporting information on the program inventory
Supporting information on planned expenditures, human resources, and results related to the CBSA's program inventory is available on GC InfoBase.
Supplementary information tables
Gender-based analysis (GBA) plus supplementary information table
Federal tax expenditures
The CBSA's Departmental Plan does not include information on tax expenditures. Tax expenditures are the responsibility of the Minister of Finance. The Department of Finance Canada publishes cost estimates and projections for government-wide tax expenditures each year in the Report on Federal Tax Expenditures. This report provides detailed information on tax expenditures, including objectives, historical background and references to related federal spending programs, as well as evaluations, research papers and gender-based analysis.
Organizational contact information
Page details
- Date modified: