We have archived this page on the web
The information on this page is for reference only. It was accurate at the time of publishing but may no longer reflect the current state at the Canada Border Services Agency. It is not subject to the Government of Canada web standards.
Executive Vice-President's Transition Binder 2019
Human Resources Branch (HRB)
Introduction
In laying out this year’s plan, the Human Resources Branch (HRB) is keeping focus on building a sustainable future – with Renewal and Nationalization leading the way – while building on our accomplishments and successes of the past, and learning from our challenges.
In support of our initiatives, programs, resources, risks and priorities, we will ensure to continue to foster our Agency values of integrity, professionalism, and respect in all that we do.
We believe that, central to the achievement of our initiatives, will be a strong emphasis on workplace wellness and culture. The HRB will aim to continue efforts to enhance the employee experience and empower all employees, regardless of level; to be agents of change so that we can continue to improve; all the while delivering great work for the Agency. The Branch prides itself on progressing as a united national Human Resources function that continuously delivers positive results in support of the Agency.
With the understanding that, by embodying our values we are putting our people first, HRB’s goal is to support a culture of equality and fairness for all. This can only be achieved by working side by side as a united team!
Senior Leadership Team
Human Resource Branch
Key deliverables
2019 to 2020 Branch priorities
- Modernize our service delivery network and simplify client experience
- Leverage workforce planning analytics and strategies
- Enable leadership excellence
- Support a healthy workplace and culture shift
Human Resources Branch top 20 deliverables
- Bill C-65 Implementation Strategy
- Year 2 of the CBSA Wellness Strategy
- Second iteration of the Agency Mental Health Strategy
- 2019-2021 Official Languages Action Plan
- 2019-2021 Employment Equity, Diversity and Inclusion Action Plans
- Year 2 of the Agency Leadership Development Strategy
- Establishment of the workforce planning and strategies function within the Agency
- Multi-year plan for the systematic review and optimization of staffing and recruitment services
- Strategy, framework and standard operating procedures for management/bargaining agent relationships
- Leverage nationalization of internal services to enhance program delivery aligned to targeted results
- One-stop “HR Hub” for HR requests from employees and managers
- National Training Strategy pilot within a corporate environment
- Advanced frontline leadership training program
- Apply LEAN to Border Services Officer recruitment process
- Modularized training for a functional community
- Complete CBSA/HR Branch planning cycles and all associated activities for 2019-20 and 2020-21
- Mentorship program for OIM applicants
- Participate in Renewal through regular staff engagement
- Year 2 of the Functional Management Model organisational design initiative
- Embed Character Based Leadership into HR programs, services and processes
Responsibilities
The CBSA’s Human Resources Branch is comprised of high-performing individuals who contribute to the Agency’s mandate by serving their clients coast to coast. Our human resources specialists deliver advice, guidance and services within seven main functions: workforce intelligence; organisational design and classification; staffing and recruitment; training and development; building a workplace of choice; restorative practices; and enabling functions.
The Human Resources Programs Directorate (HRP) is responsible for a wide range of HR services and programs within the Agency. Specifically, HRP is responsible for national staffing and recruitment policies and strategies; national staffing services; national outreach and recruitment; employment equity and official languages programs; national organizational design and classification; workforce planning; analysis and performance measurement; HR systems; and awards and recognition.
The Labour Relations and Compensation Directorate (LRCD) provides functional leadership on labour relations, compensation, integrity, and workplace wellness. LRCD is the spokesperson for engaging bargaining agents at the Agency-level and the key advisors in regional discussions. LRCD also provides guidance and support to employees on matters pertaining to their health and wellbeing. The directorate is currently comprised of four areas of expertise: Workplace Wellness, Workplace Issues management, Compensation, National Integrity Centre of Expertise.
The Training and Development Directorate (TDD) provides functional leadership over the CBSA’s formal and informal learning solutions, including setting out national policy and directives, working with program leads to maintain National Training Standards (currently frontline focused), annual confirmation of Agency and federal priorities through the National Training Plan and reporting on mandatory training results. Through the Force Generation program, TDD delivers the Officer Induction Model from recruitment and training (OITP) right to in-field development (OIDP). TDD also stewards the CBSA College network of campuses across the country, centres of expertise and the CBSA OL School widely used by the CBSA, federal partners and international institutions.
The Management Cadre Programs and Services Directorate (MCPS) drives both the national and Executive talent management, performance management, and leadership development strategy programs – impacting every employee, manager, and Executive at CBSA. The Directorate also leads organizational development, design and change management impacting the Executive cadre; Executive resourcing and succession planning; Executive compensation and benefits areas of expertise; and the planning and predictive analysis of Executive talent management needs.
The Branch Planning and Integration Management Division (BPIM) ensures horizontal management, coordination, and reporting of Agency and/or Branch deliverables through the planning, delivering, and monitoring of CBSA/HR activities. The Division operationally supports the Vice-President through the development, engagement, and communication of strategic files which include, but are not limited to Performance Management Agreements, Audits and Evaluations, Branch Governance, and Branch Finances.
Risk/Issues/Challenges
Issues at a glance
Compensation backlog
Description
Timeliness to process compensation transactions remains a pressure point for the Agency.
What we are doing about it
- Increased communications regarding timelines to complete pay actions
- Ongoing review of the compensation process from start to finish
- Develop and deliver a multiyear plan for the review and optimization of services
Headwinds
- Processes and tools are not aligned, responsive, and supportive of client needs
- Processing timelines are impacted by the cyclical implementation of collective agreements
Obligations under Bill C-65 and Safe workspaces report
Description
The Agency must take actions to address the new legislated obligation to better support employees facing harassment.
What we are doing about it
- Established the National Integrity Centre of Expertise to develop, implement, and monitor the Agency’s strategy to promote a respectful workplace climate
Headwinds
- Policy decisions in relation to the establishment of an Ombudsperson vs. and Ombuds-type function
Outdated HR systems / IT infrastructure
Description
Ensure that modern HR Systems are in place to enable Human Resources employees and managers to deliver on the Agency’s mandate.
What we are doing about it
- Ensure ongoing enhancements of HR systems to meet client needs
- Review of staffing and recruitment processes being launched to align with investments in systems
- Secure ongoing funding to ensure ongoing system integrity
Headwinds
- Lack of funding certainty, primarily as it relates to long-term business improvement initiatives and ongoing funding needs to support system enhancements
Alignment between talent availability and location
Description
Ensuring that the right people are in the right place with the right skills.
What we are doing about it
- Develop an advanced frontline leadership training program
- Deliver Indigenous Training Strategy
- Pilot a mentorship program for new recruit applicants
Headwinds
- Limited talent management and mobility programs within the CBSA
- Rigid Collective Agreements
Recruitment
Description
The Agency must identify recruitment and retention strategies that will enable HR employees and managers to deliver its mandate.
What we are doing about it
- Developing and delivering a multiyear plan for the review and optimization of staffing services
Headwinds
- Increased competition and classification variances between Departments/Agencies creates challenges in recruiting employees
- Misalignment between public service workplace and millennial/Generation Z expectations
Strategic workforce planning
Description
Managers may not develop workforce strategies that are responsive to emerging business priorities to allow HRB’s delivery of efficient and effective advice/solutions to attract, train/develop, and retain employees.
What we are doing about it
- Developing a proactive strategy to implement enhanced workforce planning
- Staffing Advisors providing support to management in the development of regional tactical and HR plans and strategies
Headwinds
- Workforce planning is an underdeveloped skillset
- Planning is not sufficiently promoted as a shared management responsibility
- Lack of clarity around roles and responsibilities in the planning functions across the Agency
Leadership
Description
Managers at various levels of the organization may not effectively lead as required to achieve the Agency’s macro-level transformation agenda.
What we are doing about it
- Character Based Leadership individual/team development
- Talent management for EX feeder groups
- Development of middle management
- Leadership Development Strategy
Headwinds
- A focus on delivering daily outputs may result in managers not sufficiently focussing on managing performance, or on exercising their HR and financial delegations.
Employee Wellness
Description
Employee morale and workplace satisfaction continues to be a prominent issue amongst CBSA employees.
What we are doing about it
- CBSA Mental Health Strategy
- Robust internal communications campaign (e.g. Atlas, CBSA Daily)
- CBSA Physical Wellness Program
Headwinds
- Multiple iterations of transformation initiatives result in change fatigue
- Limited Agency change management capacity
Force Generation
Description
Alignment of upcoming Force Generation with upcoming workforce commitments.
What we are doing about it
- Enhance the usage of data analytics in capacity planning and delivery of the National Training Plan
- Support Border 5 Countries Heads of Operation's infield training pilot of applied analytics
Headwinds
- Annual attrition rates may prevent the Agency from increasing capacity on the frontline
Functionalization/Nationalization
Description
The implementation of the Functional Management Model organizational design has pronounced effects on the Branch, with the need to develop new business processes while also having to continue day-to-day activities.
What we are doing about it
- Developing end-state models
- Stress testing.
Headwinds
- Nationalization resources have yet to be stabilized and resource allocations continue to be subject to discussions
- Limited Agency change management capacity
Management of CBSA/Bargaining Agent Relationship
Description
Already strained relationships between the CBSA and bargaining agents may continue to deteriorate.
What we are doing about it
- Development of a strategy, framework and Standard Operating Procedures for bargaining agent engagement
Headwinds
- Union is favouring a litigious approach to labour relations rather than a collaborative approach
Hot files
5A Public Service Employee Survey
Background
As you all know, the Public Service Employee Survey (PSES) provides insight into federal public service (PS) employees' engagement and into their opinions about their leadership, the workforce, their workplace, workplace well -being, and compensation. The PSES was conducted every 3 years from 1999 until 2017. In 2018, the survey became an annual survey, launched from to .
CBSA 2018 PSES - Highlights
Participation
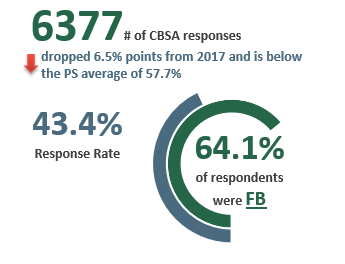
Image description
The number of CBSA responses is 6377.
- This number dropped 6.5% points from 2017 and is below the PS average of 57.7%
The infographic shows the Agency’s 2018 PSES response rate percentage:
- CBSA’s response rate: 43.4%
- FB respondents of CBSA’s response rate: 64.1%
CBSA vs similar OGDs
Source: 2018 Public Service Employee Survey Results, Treasury Board of Canada Secretariat
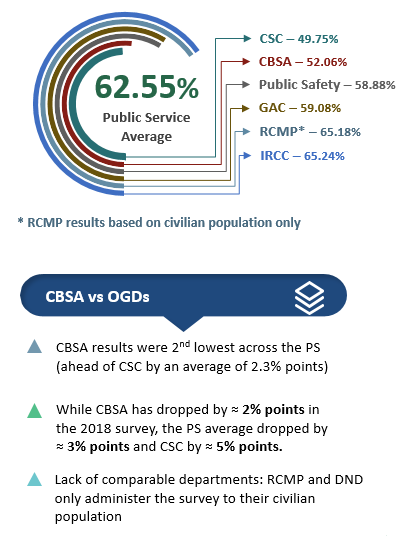
Image description
The average positive response rate across the Public Service is 62.55%. For CBSA and similar departments it is as follows: CSC 49.75%, CBSA 52.06%, Public Safety 58.88%, GAC 59.08%, RCMP civilian employees 65.18%, and IRCC 65.24%.
Source Data:
| OGD (by percentage) | Average Positive Response Rate |
|---|---|
| Public Service | 62.55 |
| CSC | 49.75 |
| CBSA | 52.06 |
| Public Safety | 58.88 |
| GAC | 59.08 |
| RCMP | 65.18 |
| IRCC | 65.24 |
Source: 2018 Public Service Employee Survey Results, Treasury Board of Canada Secretariat
Note: RCMP results are based on civilian population only.
Most improved
Source: 2017 and 2018 Public Service Employee Survey Results, Treasury Board of Canada Secretariat
Image description
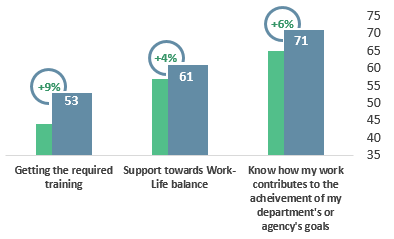
The PSES questions with the greatest improvement between the 2017 and 2018 PSE Surveys were:
- Getting the required training, increase of 12 percentage points from 44 to 56
- Support towards work-life balance, an increase of 4 percentage points from 57 to 61
- Know how my work contributes to the achievement of my department’s or agency goals, an increase of 6 percentage points from 65 to 71
Source Data:
| PSES Questions (by percentage) | 2017 PSES | 2018 PSES | Percentage point increase |
|---|---|---|---|
| Getting the required training | 44 | 56 | +12 |
| Support towards Work-Life balance | 57 | 61 | +4 |
| Know how my work contributes to the achievement of my department's or agency's goals | 65 | 71 | +6 |
Source: 2017 and 2018 Public Service Employee Survey Results, Treasury Board of Canada Secretariat
CBSA average positive response rate
Source: 2018 Public Service Employee Survey Results, Treasury Board of Canada Secretariat
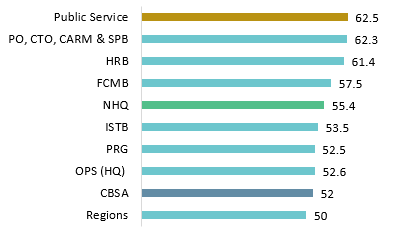
Image description
The 2018 PSES Average Positive Response Rate by Organization, Branch and Region is as follows: Public Service 62.5%, PO, CTO, CARM and SPB 62.3%, HRB 61.4%, FCMB 57.5%, HQ 55.4%, ISTB 53.5%, PRG 52.5%, Ops (HQ) 52.6%, CBSA 52%, and Regions 50.0%.
Note: PO, CTO, CARM and SPB are summed together since they have a low population.
Source Data:
| Organization, Branch and Region (by percentage) | Average Positive Response Rate |
|---|---|
| Public Service | 62.5 |
| PO, CTO, CARM and SPB | 62.3 |
| HRB | 61.4 |
| FCMB | 57.5 |
| HQ | 55.4 |
| ISTB | 53.5 |
| PRG | 52.5 |
| OPS (HQ) | 52.6 |
| CBSA | 52.0 |
| Regions | 50.0 |
Source: 2018 Public Service Employee Survey Results, Treasury Board of Canada Secretariat
Note: PO, CTO, CARM and SPB are summed together since they have a low population.
Requires attention
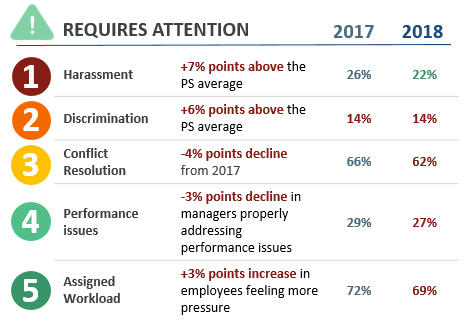
Image description
- Harassment
- +7% points above the PS average
- 2017: 26%
- 2018: 22%
- Discrimination
- +6% points above the PS average
- 2017: 14%
- 2018: 14%
- Conflict Resolution
- -4% points decline from 2017
- 2017: 66%
- 2018: 62%
- Performance issues
- -3% points decline in managers properly addressing performance issues
- 2017: 29%
- 2018: 27%
- Assigned Workload
- +3% points increase in employees feeling more pressure
- 2017: 72%
- 2018: 69%
CBSA’s response rate has dropped by 6.5% from last year. This decrease in responses could be attributed to a combination of different factors; namely due to survey fatigue, survey launch during peak period within the Canada Border Services Agency (CBSA), as well as the fact that front-line staff may have a more difficult time accessing technology to complete such a lengthy survey.
CBSA results were 2nd lowest across the PS (but substantially ahead of Correctional Service of Canada, by an average of 2.3 percentage points per question). The CBSA was last or next-to-last in every PSES. Direct comparison to other law enforcement agencies/departments is difficult as "font-line staff" is usually excluded from the PSES survey (i.e. Department of National Defence military, Royal Canadian Mounted Police - police).
It appears that CBSA actions to address its poor showing in the 2017 PSES may be having an impact on the overall results for the organization in 2018. Employees are feeling more confident with the training they receive, work-life balance as well as their role at the CBSA. Although there is still much to do in order to maintain this trend, communication remains a key aspect to link the work employees are doing in regards to the CBSA's objectives.
The 5 top areas requiring improvement at the CBSA are not easily improved as there is a link with the type of work (front-line law enforcement) and the culture at the Agency: We require greater awareness and tools to deal with the following issues: Harassment (7% above PS average). Discrimination (6% above PS average),Conflict Resolution (4% decline in employees knowing where to get help in resolving conflict, from 2017), Performance Issues (3% decline in managers properly addressing performance issues) and Pressure relating to a heavy workload (3% increase since 2017).
For the numbers on harassment and discrimination, yes we are doing worse than the Public Service in 2018. That being said, 2017 question asked about discrimination in last 24 months while the 2018 question asked about discrimination based on lost 12 months- not quite a comparable.
Quick facts
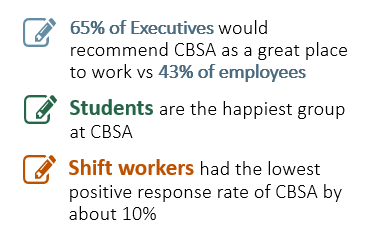
Image description
- 65% of Executives would recommend CBSA as a great place to work vs 43% of employees
- Students are the happiest group at CBSA
- Shift workers had the lowest positive response rate of CBSA by about 10%
Employment equity and diversity
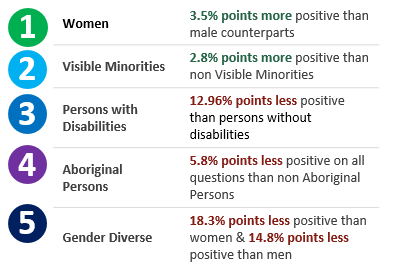
Image description
- Women: 3.5% points more positive than male counterparts
- Visible Minorities: 2.8% points more positive than non Visible Minorities
- Persons with Disabilities: 12.96% points less positive than persons without disabilities
- Aboriginal Persons: 5.8% points less positive on all questions than non Aboriginal Persons
- Gender Diverse: 18.3% points less positive than women & 14.8% points less positive than men
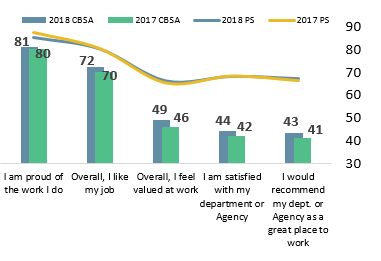
Employee engagement
Source: 2017 and 2018 Public Service Employee Survey Results, Treasury Board of Canada Secretariat
Image description
The PSES Average Positive Response Rate by Employee Engagement Questions is as follows:
- I am proud of the work I do: 81% on the 2018 CBSA PSES and 80% in 2017. For the 2018 Public Service result it was 85% and 87% in 2017.
- Overall I like my job: 72% on the 2018 CBSA PSES and 70% in 2017. For the 2018 Public Service result it was 80% and 80% in 2017.
- Overall I feel valued at work: 49% on the 2018 CBSA PSES and 46% in 2017. For the 2018 Public Service result it was 66% and 65% in 2017.
- I am satisfied with my department or agency: 44% on the 2018 CBSA PSES and 42% in 2017. For the 2018 Public Service result it was 68% and 68% in 2017.
- I would recommend my department or agency as a great place to work: 43% on the 2018 CBSA PSES and 41% in 2017. For the 2018 Public Service result it was 67% and 66% in 2017.
Source Data:
| PSES Employee Engagement Questions (by percentage) | 2018 CBSA PSES | 2017 CBSA PSES | 2018 Public Service PSES | 2017 Public Service PSES |
|---|---|---|---|---|
| I am proud of the work I do. | 81 | 80 | 85 | 87 |
| Overall, I like my job. | 72 | 70 | 80 | 80 |
| Overall, I feel valued at work. | 49 | 46 | 66 | 65 |
| I am satisfied with my department or Agency. | 44 | 42 | 68 | 68 |
| I would recommend my department or Agency as a great place to work. | 43 | 41 | 67 | 66 |
Source: 2017 and 2018 Public Service Employee Survey Results, Treasury Board of Canada Secretariat
Overview of themes
Source: 2018 Public Service Employee Survey Results, Treasury Board of Canada Secretariat
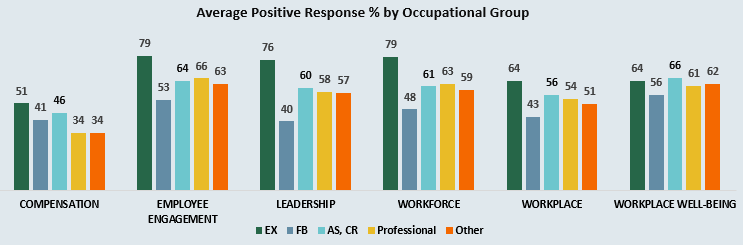
Image description
The 2018 PSES Average Positive Response Rate by Occupational Group within PSES themes are as follows:
- For compensation: EX 51%, FB 41%, Administrative Groups AS and CR 46% Professional Groups 34% and Other 34%
- For Employee Engagement: EX 79%, FB 53%, Administrative Groups AS and CR 64% Professional Groups 66% and Other 63%
- For Leadership: EX 76%, FB 40%, Administrative Groups AS and CR 60% Professional Groups 58% and Other 57%
- For Workforce: EX 79%, FB 48%, Administrative Groups AS and CR 61% Professional Groups 63% and Other 59%
- For Workplace: EX 64%, FB 43%, Administrative Groups AS and CR 56% Professional Groups 54% and Other 51%
- For Workplace well being: EX 64%, FB 56%, Administrative Groups AS and CR 66% Professional Groups 61% and Other 62%
Source Data:
| PSES Themes (by percentage) | EX | FB | Administrative Groups (AS & CR) | Professional Groups | Other |
|---|---|---|---|---|---|
| Compensation | 51 | 41 | 46 | 34 | 34 |
| Employee Engagement | 79 | 53 | 64 | 66 | 63 |
| Leadership | 76 | 40 | 60 | 58 | 57 |
| Workforce | 79 | 48 | 61 | 63 | 59 |
| Workplace | 64 | 43 | 56 | 54 | 51 |
| Workplace Well-Being | 64 | 56 | 66 | 61 | 62 |
Source: 2018 Public Service Employee Survey Results, Treasury Board of Canada Secretariat
Highlights
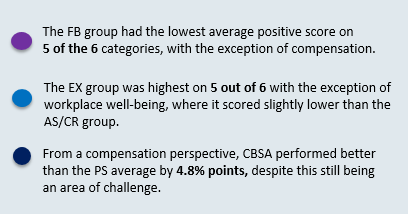
Image description
- The FB group had the lowest average positive score on 5 of the 6 categories, with the exception of compensation.
- The EX group was highest on 5 out of 6 with the exception of workplace well-being, where it scored slightly lower than the AS/CR group.
- From a compensation perspective, CBSA performed better than the PS average by 4.8% points, despite this still being an area of challenge.
Employee engagement and pride in its organization has a large impact on CBSA culture and is quite important to an employee's sense of well-being and belonging. Studies show that the level of engagement of Senior Leaders will have a cascading effect down to middle managers and employees.
There is a strong correlation between the quality of supervision on overall job satisfaction; when employers care about the wellbeing of their employees, this in turn will result in employees caring about the business.
Employees that feel a sense of purpose will also display sentiments of well-being. PSES results show that CBSA employees are very proud of the work that they do (81%),and have an overall feeling of well-being at work (67%). While these are relatively positive responses, of note that only 43% would recommend the Agency as a great place to work.
Students are the happiest group at CBSA (73.72%). This positive result is likely due to the launch of the Student Experience Office as well as various engagement activities and student community forums.
Respondents identifying as Gender Diverse, were the least positive of the groups within Employee Equity Diversity and Inclusion (18.3% less positive than women and 14.8% less positive than men).
Studying the 6 themes (compensation, employee engagement, leadership, workforce, workplace and workplace well-being),it is not surprising that the average response for Compensation is the lowest of all. Of note however, that CBSA has performed better than the PS average by 4.8% due to the proximity of our compensation advisors.
The FB Group has the lowest average score for 5 of the 6 categories, while the EX group is very happy at CBSA with the highest score for 5 out of 6 categories.
5B Deputy Minister University Champion
Deputy Minister University Champion Initiative
Synopsis:
The purpose of this document is to describe the support and role of the Canada Border Services Agency’s (CBSA) Human Resources Branch in supporting the Deputy Minister in his or her Deputy Minister University Champion (DMUC) role.
Background:
The DMUC Initiative is aimed at strengthening linkages between the Government of Canada and Canadian universities and to support robust and relevant public administration education and research so that the Federal Public Service has access to leading ideas and theories, a new generation of public administration scholars and new employees who are well-educated in modern public management.
Deputy Ministers have flexibility in terms of how they exercise their role in strengthening the linkages between the public service and universities. Some best practices are outlined below:
- Working with key partners on campus, usually the President of the university
- Working with universities to facilitate lectures and presentations by senior public servants
- Promoting opportunities for mid-career public servants, specifically the Public Servant-in-Residence Program, to executives in departments and universities
- Advising students and graduates of employment opportunities within the federal public service and promoting the public service as a career choice
- Assisting faculty members in the development of research projects and activities in order to increase the relevance of their work for the public service
CBSA’s Human Resources Branch Strategic Workforce Management Division is responsible to provide support, advice, and coordination between the Agency and assigned universities for all DMUC initiatives.
Context & analysis
Since 2017, efforts have been focused on establishing relationships with the University of Victoria (UVic) and Royal Roads University (RRU) due to President Ossowski’s DMUC role with these two institutions. We have also established a partnership with Trent University, due to former CBSA Executive Vice-President Namiesniowski’s DMUC role with this institution.
The recent appointment of Deputy Namiesniowski to the Public Health Agency of Canada (PHAC) has resulted in the Trent University Champion role moving to PHAC, but because the DMUC Initiative is a “whole of government” initiative, the CBSA will continue working with Trent and PHAC on initiatives currently underway.
Given the need for public service renewal, the CBSA is working in partnership with UVic, RRU and Trent faculty, students and career services functions for the purpose of recruiting post-secondary students and graduates for careers in the public service and the CBSA.
More particularly, the CBSA is engaged in the following activities:
- Participating in targeted recruitment and networking activities for high demand, shortage and difficult to fill positions such as data analytics and forensic science
- Leveraging the placement of Student Ambassadors who spend a portion of their working hours on campus, engaging with students and university officials to promote the Government of Canada as an employer of choice
- Developing stronger relationships with UVic, RRU, and Trent faculty and students on issues of common interest that support academic research, fulfilment of student learning, and that enable the CBSA to meet its mandate. For example, the CBSA recently engaged with UVic’s Borders in Globalization program to offer summer workshops on border and global management. This initiative will result in a number of research papers on CBSA related themes such as Asylum Reform
- Establishing strategic relationships with university ancillary functions like UVic’s CanAssist whose mission, vision and programs can enable the Government of Canada to satisfy its legislative requirements like those resulting from the anticipated implementation of the Accessible Canada Act
- Exploring opportunities to influence curriculum development that aligns with the knowledge, skills, and abilities required from CBSA’s future workforce
Key next steps
If the incoming Deputy Head has not been assigned a university to champion, the Canada School of Public Service will facilitate this partnership. Once assigned, the Agency’s Strategic Workforce Management Division will work with the Deputy Head to determine priorities, roles, responsibilities, and timeframes.
If the incoming Deputy Head is currently assigned a university, the Deputy Head will continue supporting that institution. In this case, the Strategic Workforce Management Division will liaise with the Deputy Head and the Deputy’s former department to facilitate the transition of work to the Canada Border Services Agency.
5C Force Generation
Synopsis:
The Force Generation Program is the process by which the Agency resources the personnel needed to carry out its mandate. It ensures the availability of a fully-trained, skilled and cohesive border services workforce, and that Canada’s front-line is staffed to address operational requirements, with the knowledge and skills to respond to current and future border needs.
Background:
Force Generation responds to Agency business requirements to deliver a baseline number of recruits annually to address front-line attrition rates and changes in front-line workforce demand. The Canada Border Services Agency’s (CBSA) front-line provides integrated border services that support national security and public safety priorities and facilitate the free flow of persons and goods, including animals and plants, which meet all requirements under the program legislation. Databases and tracking mechanisms to manage the program and its outputs are in place.
Context & analysis
Force Generation collects and analyzes key activities related to our current front-line officers including outreach, recruitment, training and development to ensure a sustainable front-line workforce of the future in order to support national security and public safety priorities and facilitate the free flow of persons and goods.
The Force Generation Program is grouped into three key areas:
- Outreach, Recruitment and Staffing
- Officer Induction Training Program
- Officer Induction Development Program and Specialized Training and Maintenance
The Force Generation Program accomplishes its mandates through various activities:
- The recruitment, training and development of future officer trainees and border services officers, which is viewed as the primary feeder group for all front-line positions
- Recruitment and staffing of specialized front-line positions
- Training to address specialized requirements; including the design, development and maintenance of training and related standards; and the planning, management, coordination, delivery and evaluation of training for the front-line
Resources (human, financial and technological) used to carry out the Force Generation Program focus on the recruitment, outreach, and management of officer trainees at the front end as the CBSA recruits are seen as the primary feeder group for all other front-line positions within the CBSA continuing the development and delivery of training to support all front-line positions as employees move beyond the FB-03 Border Services Officer function.
Key next steps
The CBSA has been working to stabilize baseline funding for the annual training of 300 new officers trainees in order to accommodate for the expected attrition rates within the front-line job community. In addition, seeking additional funding to meet this ongoing attrition and to fulfill the officer needs for various new projects and initiatives put forth from the Federal Government of Canada.
The Force Generation Program continues to evolve finding efficiencies to improve the program, including implementing recommendations from the Officer Induction Model Management Response Action Plan undertaken by Audit and Evaluation.
Building on the Border of the Future 2030 Strategic Vision, the CBSA is exploring how we train and equip our existing and future workforce to ensure they have the right skills to operate in a dynamic and challenging border of the future environment and create a resilient culture that can adapt to and harness technologically-advanced processes and capabilities by developing a Border of the Future officer profile and competencies.
Prepared by:
Keren Hawkins
Acting Vice-president
Human Resources Branch
Demographic report
CAS Source Date
Includes:
Active and inactive employees / based upon employees' substantive group and level and substantive cost centre
indeterminate, determinate, student, seasonal and casual employees
| Employee tenure | Atlantic | Quebec | NOR | HQ-NCR | GTA | SOR | Prairie | Pacific | Missing/Closed CC | Total | % |
|---|---|---|---|---|---|---|---|---|---|---|---|
| Indeterminate | 657 | 1,881 | 590 | 4,404 | 2,064 | 1,557 | 1,108 | 1,772 | 0 | 14,033 | 87.7% |
| Determinate | 2 | 35 | 3 | 180 | 24 | 14 | 7 | 45 | 0 | 310 | 1.9% |
| Casual | 13 | 57 | 10 | 309 | 37 | 0 | 43 | 39 | 0 | 508 | 3.2% |
| Student | 28 | 210 | 25 | 198 | 333 | 9 | 109 | 217 | 0 | 1,129 | 7.1% |
| Seasonal | 12 | 0 | 5 | 1 | 0 | 0 | 2 | 2 | 0 | 22 | 0.1% |
| Total | 712 | 2,183 | 633 | 5,092 | 2,458 | 1,580 | 1,269 | 2,075 | 0 | 16,002 | |
| % of population | 4.4% | 13.6% | 4.0% | 31.8% | 15.4% | 9.9% | 7.9% | 13.0% | 0.0% |
| Substantive and acting employees | Atlantic | Quebec | NOR | HQ-NCR | GTA | SOR | Prairie | Pacific | Missing/Closed CC | Total | % |
|---|---|---|---|---|---|---|---|---|---|---|---|
| Substantive | 626 | 1,760 | 558 | 4,485 | 1,950 | 1,487 | 1,048 | 1,702 | 0 | 13,616 | 85.1% |
| Acting | 45 | 156 | 40 | 100 | 138 | 84 | 69 | 117 | 0 | 749 | 4.7% |
| Not applicable Footnote 2 | 41 | 267 | 35 | 507 | 370 | 9 | 152 | 256 | 0 | 1,637 | 10.2% |
| Total | 712 | 2,183 | 633 | 5,092 | 2,458 | 1,580 | 1,269 | 2,075 | 0 | 16,002 |
| Active and inactive employees | Atlantic | Quebec | NOR | HQ-NCR | GTA | SOR | Prairie | Pacific | Missing/Closed CC | Total | % |
|---|---|---|---|---|---|---|---|---|---|---|---|
| Active | 672 | 2,056 | 601 | 4766 | 2,308 | 1,497 | 1,189 | 1,933 | 0 | 15,022 | 93.9% |
| InactiveFootnote 1 | 40 | 127 | 326 | 100 | 150 | 83 | 80 | 142 | 0 | 980 | 6.1% |
| Total | 712 | 2,183 | 633 | 5,092 | 2,458 | 1,580 | 1,269 | 2,075 | 0 | 16,002 |
| Sex | Atlantic | Quebec | NOR | HQ-NCR | GTA | SOR | Prairie | Pacific | Missing/Closed CC | Total | % |
|---|---|---|---|---|---|---|---|---|---|---|---|
| Female | 321 | 1,031 | 252 | 2,944 | 1,225 | 642 | 571 | 928 | 0 | 7,914 | 49.5% |
| Male | 391 | 1,152 | 381 | 2,148 | 1,233 | 938 | 698 | 1,147 | 0 | 8,088 | 50.5% |
| Total | 712 | 2,183 | 633 | 5,092 | 2,458 | 1,580 | 1,269 | 2,075 | 0 | 16,002 |
| First official language | Atlantic | Quebec | NOR | HQ-NCR | GTA | SOR | Prairie | Pacific | Missing/Closed CC | Total | % |
|---|---|---|---|---|---|---|---|---|---|---|---|
| English | 579 | 459 | 528 | 3,468 | 2,391 | 1,522 | 1,209 | 2,050 | 0 | 12,206 | 76.3% |
| French | 133 | 1,724 | 105 | 1,624 | 67 | 58 | 60 | 25 | 0 | 3,796 | 23.7% |
| Total | 712 | 2,183 | 633 | 5,092 | 2,458 | 1,580 | 1,269 | 2,075 | 0 | 16,002 |
| Bilingual bonus | Atlantic | Quebec | NOR | HQ-NCR | GTA | SOR | Prairie | Pacific | Missing/Closed CC | Total | % |
|---|---|---|---|---|---|---|---|---|---|---|---|
| Yes | 251 | 1,838 | 193 | 2,278 | 186 | 234 | 107 | 52 | 0 | 5,139 | 32.1% |
| No | 420 | 78 | 405 | 2,307 | 1,902 | 1,337 | 1,010 | 1767 | 0 | 9,226 | 57.7% |
| Not applicableFootnote 2 | 41 | 267 | 35 | 507 | 370 | 9 | 152 | 256 | 0 | 1,637 | 10.2% |
| Total | 712 | 2,183 | 633 | 5,092 | 2,458 | 1,580 | 1,269 | 2,075 | 0 | 16,002 |
Age
| Age | Atlantic | Quebec | NOR | HQ-NCR | GTA | SOR | Prairie | Pacific | Missing/Closed CC | Total | % |
|---|---|---|---|---|---|---|---|---|---|---|---|
| 0-19 | 2 | 24 | 4 | 34 | 61 | 0 | 23 | 31 | 0 | 179 | 1.1% |
| 20-24 | 30 | 217 | 26 | 334 | 287 | 30 | 123 | 241 | 0 | 1,288 | 8.0% |
| 25-29 | 26 | 166 | 37 | 406 | 185 | 109 | 117 | 202 | 0 | 1,248 | 7.8% |
| 30-34 | 76 | 225 | 89 | 490 | 221 | 234 | 169 | 261 | 0 | 1,765 | 11.0% |
| 35-39 | 149 | 381 | 134 | 777 | 401 | 321 | 214 | 362 | 0 | 2,739 | 17.1% |
| 40-44 | 141 | 438 | 110 | 812 | 367 | 238 | 164 | 310 | 0 | 2,580 | 16.1% |
| 45-49 | 105 | 275 | 97 | 728 | 274 | 237 | 152 | 273 | 0 | 2,141 | 13.4% |
| 50-54 | 94 | 233 | 78 | 742 | 254 | 213 | 141 | 203 | 0 | 1,958 | 12.2% |
| 55-59 | 65 | 156 | 45 | 500 | 244 | 145 | 111 | 122 | 0 | 1,388 | 8.7% |
| 60-64 | 21 | 54 | 8 | 207 | 116 | 36 | 44 | 56 | 0 | 542 | 3.4% |
| 65+ | 3 | 14 | 5 | 62 | 48 | 17 | 11 | 14 | 0 | 174 | 1.1% |
| Total | 712 | 2,183 | 633 | 5,092 | 2,458 | 1,580 | 1,269 | 2,075 | 0 | 16,002 | |
| Average age | 42.5 | 40.1 | 41.2 | 42.4 | 40.7 | 42.3 | 40.0 | 38.9 | 0.0 | 41.1 |
| Years of service | Atlantic | Quebec | NOR | HQ-NCR | GTA | SOR | Prairie | Pacific | Missing/Closed CC | Total | % |
|---|---|---|---|---|---|---|---|---|---|---|---|
| 0-4 | 74 | 426 | 78 | 988 | 368 | 290 | 257 | 397 | 0 | 2,878 | 18.0% |
| 5-9 | 86 | 227 | 85 | 467 | 137 | 136 | 173 | 204 | 0 | 1,515 | 9.5% |
| 10-14 | 223 | 557 | 152 | 1,217 | 550 | 401 | 277 | 497 | 0 | 3,874 | 24.2% |
| 15-19 | 143 | 379 | 128 | 875 | 412 | 355 | 158 | 336 | 0 | 2,786 | 17.4% |
| 20-24 | 43 | 115 | 46 | 366 | 164 | 103 | 78 | 150 | 0 | 1,065 | 6.7% |
| 25-29 | 66 | 119 | 71 | 407 | 227 | 126 | 102 | 126 | 0 | 1,244 | 7.8% |
| 30-34 | 26 | 74 | 28 | 199 | 162 | 121 | 59 | 72 | 0 | 741 | 4.6% |
| 35+ | 10 | 15 | 10 | 57 | 67 | 37 | 12 | 21 | 0 | 229 | 1.4% |
| Data not availableFootnote 3 | 0 | 4 | 0 | 9 | 1 | 2 | 1 | 16 | 0 | 33 | 0.2% |
| Not applicableFootnote 2 | 41 | 267 | 35 | 507 | 370 | 9 | 152 | 256 | 0 | 1,637 | 10.2% |
| Total | 712 | 2,183 | 633 | 5,092 | 2,458 | 1,580 | 1,269 | 2,075 | 0 | 16,002 | |
| Average years of service | 14.4 | 12.5 | 14.9 | 13.3 | 15.6 | 14.7 | 12.8 | 13.0 | 0.0 | 13.7 |
| Eligibility to retire without financial penaltyFootnote 4 | Atlantic | Quebec | NOR | HQ-NCR | GTA | SOR | Prairie | Pacific | Missing/Closed CC | Total | % |
|---|---|---|---|---|---|---|---|---|---|---|---|
| 2019-20 | 43 | 133 | 37 | 409 | 320 | 153 | 99 | 126 | 0 | 1,320 | 18.0% |
| 2020-21 | 23 | 41 | 12 | 139 | 76 | 44 | 29 | 35 | 0 | 399 | 9.5% |
| 2021-22 | 29 | 39 | 12 | 127 | 45 | 53 | 27 | 34 | 0 | 366 | 24.2% |
| 2022-23 | 19 | 32 | 19 | 128 | 50 | 28 | 24 | 37 | 0 | 337 | 17.4% |
| 2023-24 | 15 | 33 | 14 | 124 | 44 | 34 | 29 | 37 | 0 | 330 | 6.7% |
| 2024-25+ | 542 | 1,634 | 504 | 3,649 | 1,552 | 1,257 | 908 | 1,534 | 0 | 11,580 | 7.8% |
| Data not availableFootnote 3 | 0 | 4 | 0 | 9 | 1 | 2 | 1 | 16 | 0 | 33 | 0.2% |
| Not applicableFootnote 2 | 41 | 267 | 35 | 507 | 370 | 9 | 152 | 256 | 0 | 1,637 | 10.2% |
| Total | 712 | 2,183 | 633 | 5,092 | 2,458 | 1,580 | 1,269 | 2,075 | 0 | 16,002 |
| Eligibility to retire with full pensionFootnote 5 | Atlantic | Quebec | NOR | HQ-NCR | GTA | SOR | Prairie | Pacific | Missing/Closed CC | Total | % |
|---|---|---|---|---|---|---|---|---|---|---|---|
| 2019-20 | 11 | 18 | 14 | 63 | 79 | 42 | 17 | 24 | 0 | 268 | 1.7% |
| 2020-21 | 1 | 5 | 2 | 18 | 21 | 7 | 3 | 8 | 0 | 65 | 0.4% |
| 2021-22 | 3 | 14 | 1 | 31 | 21 | 22 | 10 | 15 | 0 | 117 | 0.7% |
| 2022-23 | 9 | 18 | 5 | 54 | 36 | 46 | 17 | 16 | 0 | 201 | 1.3% |
| 2023-24 | 7 | 23 | 11 | 64 | 56 | 24 | 15 | 24 | 0 | 224 | 1.4% |
| 2024-25+ | 640 | 1,834 | 565 | 4,346 | 1,874 | 1,428 | 1,054 | 1,716 | 0 | 13,457 | 84.1% |
| Data not availableFootnote 3 | 0 | 4 | 0 | 9 | 1 | 2 | 1 | 16 | 0 | 33 | 0.2% |
| Not applicableFootnote 2 | 41 | 267 | 35 | 507 | 370 | 9 | 152 | 256 | 0 | 1,637 | 10.2% |
| Total | 712 | 2,183 | 633 | 5,092 | 2,458 | 1,580 | 1,269 | 2,075 | 0 | 16,002 |
| Occupational group | Atlantic | Quebec | NOR | HQ-NCR | GTA | SOR | Prairie | Pacific | Missing/Closed CC | Total | % |
|---|---|---|---|---|---|---|---|---|---|---|---|
| AS | 10 | 23 | 4 | 865 | 20 | 14 | 9 | 17 | 0 | 962 | 6.0% |
| AU | 0 | 0 | 0 | 10 | 0 | 0 | 0 | 0 | 0 | 10 | 0.1% |
| CH | 0 | 0 | 0 | 45 | 0 | 0 | 0 | 0 | 0 | 45 | 0.3% |
| CO | 0 | 0 | 0 | 57 | 0 | 0 | 0 | 0 | 0 | 57 | 0.4% |
| CR | 39 | 304 | 36 | 356 | 303 | 116 | 143 | 293 | 0 | 1,590 | 9.9% |
| CS | 1 | 1 | 1 | 634 | 0 | 1 | 1 | 1 | 0 | 640 | 4.0% |
| DM | 0 | 0 | 0 | 1 | 0 | 0 | 0 | 0 | 0 | 1 | 0.0% |
| EC | 0 | 0 | 0 | 179 | 0 | 0 | 0 | 0 | 0 | 179 | 1.1% |
| ED-LAT | 0 | 0 | 0 | 18 | 0 | 0 | 0 | 0 | 0 | 18 | 0.1% |
| EG | 0 | 0 | 0 | 15 | 0 | 0 | 0 | 0 | 0 | 15 | 0.1% |
| EL | 0 | 0 | 0 | 9 | 0 | 0 | 0 | 0 | 0 | 9 | 0.1% |
| EN-ENG | 0 | 0 | 0 | 14 | 0 | 0 | 0 | 0 | 0 | 14 | 0.1% |
| EX | 4 | 7 | 4 | 140 | 7 | 8 | 6 | 9 | 0 | 185 | 1.2% |
| FB | 609 | 1,604 | 554 | 1,820 | 1,784 | 1,418 | 972 | 1,524 | 0 | 10,285 | 64.3% |
| FI | 6 | 12 | 6 | 148 | 8 | 8 | 7 | 6 | 0 | 201 | 1.3% |
| FS | 0 | 0 | 0 | 0 | 0 | 0 | 0 | 0 | 0 | 0 | 0.0% |
| GL-ELE | 0 | 0 | 0 | 10 | 0 | 0 | 0 | 1 | 0 | 11 | 0.1% |
| GL-MAN | 0 | 0 | 0 | 2 | 0 | 0 | 0 | 0 | 0 | 2 | 0.0% |
| GL-MDO | 0 | 1 | 0 | 0 | 0 | 2 | 0 | 0 | 0 | 3 | 0.0% |
| GS-STS | 1 | 8 | 0 | 8 | 2 | 1 | 2 | 3 | 0 | 25 | 0.2% |
| GT | 0 | 0 | 0 | 8 | 0 | 0 | 0 | 0 | 0 | 8 | 0.0% |
| IS | 0 | 0 | 0 | 103 | 0 | 0 | 0 | 0 | 0 | 103 | 0.6% |
| LS | 0 | 0 | 0 | 0 | 0 | 0 | 0 | 0 | 0 | 0 | 0.0% |
| MA | 0 | 0 | 0 | 5 | 0 | 0 | 0 | 0 | 0 | 5 | 0.0% |
| OM | 0 | 0 | 0 | 1 | 0 | 0 | 0 | 0 | 0 | 1 | 0.0% |
| PC | 0 | 0 | 0 | 4 | 0 | 0 | 0 | 0 | 0 | 4 | 0.0% |
| PE | 0 | 0 | 0 | 308 | 0 | 0 | 0 | 0 | 0 | 308 | 1.9% |
| PG | 1 | 2 | 3 | 30 | 2 | 3 | 2 | 3 | 0 | 46 | 0.3% |
| PM | 13 | 11 | 0 | 96 | 0 | 0 | 18 | 1 | 0 | 139 | 0.9% |
| PS | 0 | 0 | 0 | 1 | 0 | 0 | 0 | 0 | 0 | 1 | 0.0% |
| SE-RES | 0 | 0 | 0 | 7 | 0 | 0 | 0 | 0 | 0 | 7 | 0.0% |
| SU | 28 | 210 | 25 | 198 | 332 | 9 | 109 | 217 | 0 | 1,128 | 7.0% |
| Blank | 0 | 0 | 0 | 0 | 0 | 0 | 0 | 0 | 0 | 0 | 0.0% |
| Total | 712 | 2,183 | 633 | 5,092 | 2,458 | 1,580 | 1,269 | 2,075 | 0 | 16,002 |
- Date modified: