We have archived this page on the web
The information on this page is for reference only. It was accurate at the time of publishing but may no longer reflect the current state at the Canada Border Services Agency. It is not subject to the Government of Canada web standards.
Executive Vice-President's Transition Binder 2019
Travellers Branch (TB)
Travellers Branch resource profile
| Salary ($) | Non-Salary ($) | Total ($) | |
|---|---|---|---|
| Headquarters (HQ) | |||
| 10400: Traveller Facilitation & Compliance | 16,820,896 | 4,739,305 | 21,560,201 |
| 10700: Trusted Traveller | 779,412 | 241,279 | 1,020,691 |
| 11000: Building & Equipment (Uniform Program) | 1,540,166 | 8,453,327 | 9,993,493 |
| 30100: Management & Oversight (VPO and Planning) | 3,054,924 | 126,745 | 3,181,669 |
| 10100: Targeting (IAPI) | 66,067 | 59,896 | 125,963 |
| 10500: Commercial - Trade Facilitation & Compliance (CARM) | 26,880 | 26,880 | |
| Subtotal Travellers HQ | 22,261,465 | 13,647,432 | 35,908,897 |
| Regions | |||
| 10400: Traveller Facilitation & Compliance | 420,067,462 | 18,466,660 | 438,534,122 |
| 10700: Trusted Traveller | 18,757,518 | 1,266,397 | 20,023,915 |
| Subtotal Travellers Regions | 438,824,980 | 19,733,057 | 527,768,555 |
| Total Travellers Branch | 461,086,445 | 33,380,489 | 494,466,934 |
As per 2019/20 Q1 Financial Situation Report; does not include anticipated funding.
Vice-President biography
Denis Vinette was appointed as Vice-President of the Travellers Branch on .
Prior to his role as Vice-President of Travellers Branch, he was the Associate Vice-President of the Canada Border Services Agency's Operations Branch.
Denis was hired in 1992 as a Customs Inspector in Prescott, Ontario. He became a Customs Superintendent in 1994 in Cornwall and later at Macdonald Cartier International Airport.
He later gained experience in various management positions including those of Director, Border Enforcement; Director General, Strategic Planning and Integration; Director, Personnel Security and Professional Standards; and Regional Director General, Northern Ontario Region. In , Denis assumed the position of Director General, Border Operations Directorate.
Denis graduated from the University of Ottawa and obtained a Bachelor of Social Sciences, with a concentration in Criminology and Psychology.
Vision, mission, core values
Vision
Be a global leader in traveller border services by putting people first and leveraging partnerships and technology to deliver a right-touch traveller experience.
Mission
To enhance border integrity and effectively deliver traveller services by modernizing CBSA traveller facilitation and compliance.
Travellers branch priorities 2019–2020
Our overarching priority remains our capability to successfully support and respond to the operational demands of providing 24/7 services to over 90 million travellers annually.
Functional Management Implementation
Stabilize the Organization
- Validate the mandate, vision, and mission
- Define Branch functions, roles, responsibilities
- Finalize the transfer of Information, Science and Technology Branch (ISTB) employees
- Solidify the Branch and Executive structure
- Continue to communicate and engage
Guidance and Support
- Upgrade of the Interactive Voice Response (IVR) Case Management Solution for email management at the Border Information Service (BIS) Centres.
- Upgrade the Directorate of CBSA Offices and Services (DO-RB) to Bing maps.
Modernize and Streamline
Legislative and Regulatory Work
- Entry/Exit
- Passenger Protect Program
- Program Assessments
- Risk based analysis, strategic planning and priority setting
Develop/ Deploy new technology
- Nexus Modernization
- NEXUS eGate
- Dynamic Risking
- Entry/Exit (landborder)
Risks, improvement activities and key milestones
Functional Management Model (FMM) Adoption
Adaptability of our workforce to the new Functional Management Model.
Improvement Activity:
- Internal engagement/ work in support of CBSA Renewal
- Work with the Human Resources Branch to define organization model and structure
- Ensure Branch policy and operational requirements are met and that the FMM integration is monitored for success.
Milestones / Expected Completion Date:
- Quarter 1: Identify key files, activities, and stakeholders Host Executive Planning session and all-staff Town Hall
- Quarter 2: Establish organization structure
- Quarter 3: Transition and implementation
Infrastructure
Existing fixed infrastructure, as well as the availability of efficient processing alternatives, may prevent the NEXUS program from fully meeting travellers’ expectations.
Improvement Activity:
- Current NEXUS kiosks (CBSA owned), will be replaced by new Primary Inspection Kiosks, (Airport Authority owned)
- The CBSA to launch a NEXUS modernization pilot in Pacific Region (Vancouver)
Milestones / Expected Completion Date:
- Quarter 2: PIK Deployment at Calgary Airport. PIK Optimization (Phase 3).
- Quarter 3: PIK Systematic Fingerprint Verification deployment (not inc. Pearson T1 and T3).
- Quarter 4: Deployment at T1 and T3.
NEXUS Program - Sustainability
High maintenance costs, [redacted] may lead to the unsustainability of the NEXUS program.
Improvement Activity:
- [redacted]
- Aligning the enrolment process to that of the US CBP.
Milestones / Expected Completion Date: [redacted]
NEXUS Program Awareness
Continuing with the current level of support and promotion of the NEXUS program may lead to diminishing growth in membership.
Improvement Activity:
- Use of social media such as Facebook and Twitter to promote the program
- NEXUS website hyperlink on the CBSA website
- Promotion of the program by airports
Milestones / Expected Completion Date: Potential promotional opportunities are under examination.
Traveller Volume Management
The Agency may become further challenged in managing increasing traveller volumes within acceptable service standards.
Improvement Activity:
- Dynamic risking will improve early identification and interdiction of travellers and their goods
- Biometrics expansion
- Remote traveller processing
Milestones / Expected Completion Date:
- Quarter 3:
- Biometrics - Expansion to eight major airports
- Quarter 4:
- Dynamic Risking - launch proof of concept
- Remote Traveller Processing (RTP) - Continue monitoring and supporting remote traveller processing pilot in Morses Line, Quebec and determine long term solution
Staffing plan
The Travellers Branch (HQ) has 48 planned staffing actions at Quarter 1, totalling $2 million.
Approximately 32% of planned staffing actions are associated to and funded by projects.
| Planned Staffing (Group and Level) | Number | Planned Spending ($) |
|---|---|---|
| FB | 20 | 976,000 |
| EC | 5 | 202,000 |
| AS/CR/PM | 14 | 473,000 |
| Students | 5 | 91,000 |
| EX | 4 | 281,000 |
| Total | 48 | 2,000,000 |
2019–2020 Procurement Priorities
As of Quarter 1, Travellers Branch (HQ) is forecasting a $12 million requirement for procurement priorities.
Travellers Branch is currently reviewing branch procurement in conjunction with FCMB.
| Description | Amount ($) |
|---|---|
| Uniform Program (Logistik and Pacific Safety Products) | 7,700,000 |
| Traveller Processing Modernization, Entry-Exit, etc (Consultants) | [redacted] |
| NAV Canada Memorandum of Understanding (Airline Compliance) | 750,000 |
| Printing and Scanning of E311 Declaration Cards | 553,000 |
| Other | 169,000 |
| Total | [redacted] |
Efficiency planning
Establishment of organization structures.
Opportunity for the three Branches to identify key files / key responsibilities.
Participation in the Efficiency and Modernization Committee (under discussion)
- Port of Entry Immigration Processing (in the secondary area)
- Customs Secondary Examination Processing
Dynamic Risking
Future efficiency, pending outcome of proof of concept.
Annex
Annex A: Travel and Hospitality
Travellers Branch HQ is planning $515,000 of travel and hospitality expenditures.
- $61,000 - hospitality
- $336,000 - domestic and U.S. travel
- $118,000 - international travel
ISTB transfer not included
Integrated Risk and Performance Report
Overview
The Traveller Programs Directorate’s (TPD’s) Q1/Q2 Fiscal Year 2018–19 Integrated Risk and Performance Report consists of the following components:
- Traveller Program Departmental Results Framework (DRF) and internal Key Performance Indicator (KPI) results for Q1/Q2
- Recourse traveller program results and analysis
- Operational issue/risk snapshot
DRF KPI
- Stable/improved DRF performance in Q1/Q2 2018-19;
- Inability to report on two KPIs due to data integrity issues associated with the new Operational Reporting Application (ORA)
Program Internal KPI
- Three of the six NEXUS internal KPIs require close monitoring;
- The NEXUS membership cancellation rate stands high in Q1/Q2; 75% of cancellations result from customs enforcement
Client Perspective
- Mid-year status overview of the Recourse Directorate’s activities related to Traveller Programs:
- Enforcement Appeals
- Enhanced Complaint Mechanism
- Enforcement Litigation
Operational Issues/Risks
- Growing Air traveller volume and the new operational model put air Border Wait Time (BWT) at risk;
- Increased immigration facilitation volume adding pressure to CBSA frontline resources; and
- Roving data reporting issues preventing performance evaluation
Overall Performance: Departmental Results Framework
This following table depicts the status of the Departmental Results Framework key performance indicators (KPIs) for the first 2 quarters of fiscal year 2017 to 2018 compared to fiscal year 2018 to 2019.
| Program | Departmental Result | Performance Indicator | Annual Target | 2017-18 Q1 and Q2 |
2018-19 Q1 and Q2 |
Performance status |
|---|---|---|---|---|---|---|
| Traveller Facilitation and Compliance (TFC) | Admissible travellers are processed in an efficient manner | Percentage of time the CBSA is meeting the Highway Border Wait Times (BWT) Service Standard | 95% | 97.6% | 94.8% | Decline |
| Travellers and their goods are compliant with applicable legislation | Immigration: Percentage of traveller examinations that produced a result (enforcement or facilitation action) | 31% | 27.3% | Decline | ||
| Customs: Percentage of traveller goods examinations that produced a result (enforcement or facilitation action) | 23% | 16.8% | TBD | TBD | ||
| Trusted Traveller | Trusted Traveller and Trader programs increase processing efficiency of low-risk, pre-approved travellers and trade partners | Ratio of Trusted Travellers referred for examination compared to that of conventional travellers | 1:5 | 1:4 | 1:10 | Improvement |
| Percentage of Trusted Travellers in compliance with legislation and program regulations | 95% | 99.97% | 99.97% | Stable | ||
| New Key Performance Indicators to be included in the DRF in 2019-20 | ||||||
| TFC | Admissible travellers are processed in an efficient manner | Percentage of traveller using Primary Inspection Kiosk (PIK) at PIK-ready airports | 95% | 87.1% | 92.6% | Improvement |
| Percentage of time Primary Inspection Kiosk Application is available to travellers | 99.5% | -- | 100% | Stable | ||
Long description
- The percentage of time the CBSA is meeting the Highway Border Wait Times (BWT) Service Standard declined from 2017-18 to 2018-19, and is green-meeting the target.
- The percentage of immigration traveller examinations that produced a result (enforcement or facilitation action) is still to be determined for Q1 and Q2 of 2018-19.
- The percentage of custom traveller goods examinations that produced a result (enforcement or facilitation action) is still to be determined for Q1 and Q2 of 2018-19.
- The ratio of Trusted Travellers referred for examination compared to that of conventional travellers improve from 2017-18 to 2018-19, and is green-exceeding the target.
- The percentage of Trusted Travellers in compliance with legislation and program regulations did not change from 2017-18 to 2018-19, and is green-exceeding the target.
- The percentage of travellers using Primary Inspection Kiosk (PIK) at PIK-ready airports improve from 2017-18 to 2018-19, and is yellow-slightly below the target.
- The percentage of time Primary Inspection Kiosk Application is available to travellers was not measured in 2017-18, and is green for 2018-19 exceeding the target.
Key findings:
In general, traveller programs saw stable/improved performance in Q1/Q2 2018/19 from the same period last fiscal.
The Highway BWT performance reporting methodology change introduced in Q4 last fiscal resulted in a decrease in performance results at several Highway POEs in Q1 this fiscal. In Q2, however, with the service standard adjusted from 10 to 20 minutes for weekdays in July and August, POEs generally saw improved performance results. Nationally, the BWT service standard was met 94.8% of the time in Q1/Q2. Without this adjustment, the result for Q1/Q2 would have been 93.9%.
The Immigration and Customs Examination KPI results are not yet available due to delayed release of the web-based Operational Reporting Application (ORA). Data quality analysis of ORA is currently being conducted by the Performance Reporting Unit in the new Strategic Branch. ORA is expected to address many of the challenges with the old system, and provide the Agency with a unique data governance opportunity to improve the timeliness, consistency, and completeness of Agency data.
The conventional/trusted traveller selective referral rate ratio KPI was refined for 2018-19 to reflect only Air mode traveller selective referrals, as IPIL Highway does not have the system capability to report referrals by referral type.
To fulfill the Agency’s commitment to report on the performance of external digital services, the following two KPIs are currently being tested and will be included in the DRF 2019-20 reporting cycle:
- Traveller usage of Primary Inspection Kiosk (PIK) at PIK-ready airports achieved 92.6% in Q1/Q2 2018-19, increasing from 87.1% in Q1/Q2 2017-18. Two additional airports brought PIK online in Q1 2018-19: Billy Bishop Toronto City Airport and Winnipeg Richardson Airport. A target of 95% is proposed
- The percentage of time the PIK Application is available to travellers is a new KPI that underwent testing by the IT Service Management Team. It captures full outages associated with CBSA service delivery. A full outage means all PIK sites across Canada were out of service. Outages caused by our service delivery partners (e.g., Shared Services, Port Authorities, Vendor) are not included in the calculation. A target of 99.5% is proposed
Overall Performance: Internal Key Performance Indicators
This table includes a graphically depiction of the status of the Departmental Results Framework key performance indicators (KPIs) for the first two quarters of fiscal year 2017-18 compared to fiscal year 2018-19.
| Annual target | 2017-18 Q1 and Q2 |
2018-19 Q1 and Q2 |
Performance status | |
|---|---|---|---|---|
| NEXUS Program Summary | ||||
| Awareness of the Trusted Traveller Program by potential members via views of the NEXUS application Web page | 800,000 | 420,131 | 339,929 | Decline |
| NEXUS usage in all modes (passage rate) | 9.5% | 9.5% | 9.7% | Improvement |
| Percentage of NEXUS members examined who are found to be in compliance with border legislation, regulations and program criteria | 97% | 99.97% | 99.97% | Stable |
| Percentage of time the CBSA is meeting the NEXUS Program Application Service Standard | 95% | 70.8% | 67.25% | Decline |
| Percentage of NEXUS members renewing membership | 50% | 59.6% | 66.2% | Improvement |
| Percentage of NEXUS membership cancellations –shown as yearly cumulative result | 0.02% | 0.04% | 0.03% | Decline |
| Traveller Program Service Standards | ||||
| Percentage of time the CBSA is meeting the Air BWT Service Standard – Internal only |
95% | 99.4% | 99.1% | Decline |
| Percentage of time the CBSA is meeting the CANPASS Programs Applications Service Standard | 95% | 95.8% | 100% | Improvement |
| Percentage of time the CBSA is meeting the CDRP Application Service Standard | 95% | 100% | 100% | Improvement |
| Percentage of time the CBSA is meeting the FAST Program Application Service Standard | 95% | 100% | 100% | Improvement |
| Percentage of time the CBSA is meeting the NEXUS Highway BWT Service Standard | 95% | -- | 96.4% | Stable |
Long description
- Awareness of the Trusted Traveller Program by potential members via views of the NEXUS application web page declined from 2017-18 to 2018-19, and is yellow- result is under the established target, but within a tolerance interval. It needs to be analyzed and monitored.
- NEXUS usage in all modes improved from 2017-18 to 2018-19, and is green-meeting the target.
- The percentage of NEXUS members examined who are found to be in compliance with border legislation, regulations and program criteria did not change from 2017-18 to 2018-19, and is green-exceeding the target.
- The percentage of time the CBSA is meeting the NEXUS Program Application Service Standard declined from 2017-18 to 2018-19, and is red- result is under the established target and requires urgent attention.
- The percentage of NEXUS members renewing membership improved from 2017-18 to 2018-19, and is yellow-result is under the established target, but within a tolerance interval. It needs to be analyzed and monitored.
NEXUS annual program summary
According to Google Analytics, the CBSA NEXUS application Web page views decreased in the first half of this fiscal (340K) from the same period last fiscal (420K). The United States Customs and Border Protection launched a new online Trusted Traveller portal in late 2017, which has likely led potential and existing NEXUS members to use the new portal instead of the CBSA application Web page.
Uptake of the NEXUS Program continues to grow in Q1/Q2 FY2018-19. Overall, the NEXUS share of all air and highway traveller passages is 9.7%, up from 9.5% in the same period last year. While the total air and highway traveller volume increased by 2.7% in FY2018-19 Q1/Q2, NEXUS volume increased by 5.5%.
The NEXUS program application service standard dipped considerably in 2017-18. This trend has continued into Q1/Q2 this fiscal, as the Niagara Falls/Windsor Risk Assessment Units had challenges in addressing application backlog due to staffing constraints.
Despite a decrease in the NEXUS membership cancellation volume in Q1/Q2 this fiscal (from 686 in Q1/Q2 FY 2017-18 to 453), the NEXUS membership cancellation rate (0.03%) is already above the annual target rate of 0.02%. Cancellations occur as a result of customs or immigration enforcement actions, issues of criminality, or violations of the NEXUS Program’s membership conditions. The statistics show that approximately 75% of cancellations result from a customs enforcement action. Examining historical trends, cancellation volumes vary considerably year to year. The target rate of this KPI is being re-evaluated.
Traveller Program Service Standards
Airports exhibit exceptional performance in BWTs despite increases in traveller volumes. However, issues were identified during the working group meetings, raising questions about the integrity of the results. (see slide 6 for more information).
Trusted Traveller Programs’ Application Service Standards continue to present stable results. As of April 3, 2018, CANPASS Air and CANPASS Private Boats are no longer accepting applications. The service standard now reflects the processing of CANPASS Corporate Aircraft and Private Aircraft applications only.
The NEXUS Highway BWT Service Standard was introduced in October this year and is applicable to five POEs (Douglas, Pacific Highway in Pacific Region, and Peace Bridge, Whirlpool Bridge, and Queenston-Lewiston Bridge in Southern Ontario Region). TPD is currently examining the feasibility of expanding this service standard to two additional POEs (Aldergrove and Abbotsford-Huntingdon).
Client Perspective: Recourse – Q1 and Q2 – Travellers – National
| 2016-17 Q1 and Q2 |
2017-18 Q1 and Q2 |
2018-19 Q1 and Q2 |
|
|---|---|---|---|
| Volumes | |||
| Enforcement Actions (K19s) | 6,986 | 7,878 | 8,509 |
| Appeals Opened | 661 | 601 | 687 |
| Appeal Rate | 9% | 8% | 8% |
| Outcomes | |||
| Total Decisions Issued | 543 | 517 | 518 |
| Percentage Upheld | 71% | 65% | 61% |
| Percentage Amended | 18% | 20% | 17% |
| Percentage Overturned | 11% | 15% | 22% |
| 2016-17 Q1 and Q2 |
2017-18 Q1 and Q2 |
2018-19 Q1 and Q2 |
||||
|---|---|---|---|---|---|---|
| Timeliness | ||||||
| Performance Indicators | Target | Actual | Target | Actual | Target | Actual |
| Percentage of First Contacts within 14 days | 85% | 87% | 85% | 89% | 85% | 73% |
| Percentage of Final Responses within 40 days | 85% | 98% | 85% | 98% | 85% | 93% |
| Volumes | ||||||
| Number of Compliments received | 184 | 157 | 193 | |||
| Number of Comments received | 96 | 155 | 103 | |||
| Number of Complaints received | 1,265 | 903 | 1,037 | |||
| Total Feedback received | 1,545 | 1,215 | 1,333 | |||
| Traveller to Complaint ratio | 44,647 : 1 | 59,281 : 1 | 50,567 : 1 | |||
| Outcomes | ||||||
| Number of Complaints closed | 1,038 | 906 | 1044 | |||
| Percentage of Complaints founded | 20% | 18% | 20% | |||
| 2016-17 Q1 and Q2 |
2017-18 Q1 and Q2 |
2018-19 Q1 and Q2 |
|
|---|---|---|---|
| Enforcement Appeals before the Courts (Provincial and Federal) | |||
| Intakes | 14 | 10 | 10 |
| Closures | 18 | 11 | 12 |
| Percentage of Positive Outcomes | 67% | 82% | 75% |
| Canadian Agricultural Review Tribunal | |||
| Intakes | 17 | 15 | 7 |
| Closures | 13 | 4 | 8 |
| Percentage of Positive Outcomes | 75% | 25% | 75% |
| Canadian Human Rights Commission | |||
| Intakes | 1 | 4 | 4 |
| Closures | 1 | 0 | 2 |
| Percentage of Positive Outcomes | 100% | N/A | 100% |
No Activity from the Canadian Human Rights Tribunal to report
Appeal Overturn rates - National
Top three overturned reasons:
- Incorrect contravention/allegation – 16% (18) (The action was cancelled as a result of incorrect determination)
- Incorrect info - based on docs from issuing office –11% (13) (Evidence provided by claimant was sufficient. Consequently, the enforcement action was cancelled)
- Document received from claimant after EA – 11% (13) (Goods were reported or were not subject to scrutiny therefore no enforcement action was required)
Founded Complaints - National
Top three founded complaint types:
- Officer Conduct – 30% (Allegations of Misconduct and/or Discrimination)
- Targeting – 19% (Customs and Immigration Flag Issues, Frequent Referrals, Advanced Commercial Information (ACI) or Advanced Passenger Information (API)/Passenger Name Record (PNR))
- Trusted travellers/Traders – 11% (NEXUS, Free and Secure Trade (FAST) driver program, CANPASS, Automated Border Clearance (ABC), Customs Self-Assessment (CSA) )
Sources: RCMS Enforcement 2018-10-30, ICES 2018-11-01, ECM CCCDB 2018-10-31
Operational Issue/Risk
Operational Issue/Risk #1: Growing Air Traveller Volume and the PIK Operational Model Increased Need for BWT Monitoring
Risk Description: Work in progress
Increased traveller volumes adding pressure to POE resources in order to meet internal BWT service standard.
Operation changes resulting from PIK put BWT measuring and reporting at risk.
Findings
The need for reliable BWT data collection in the air mode is captured in a number of CBSA commitments. CBSA’s Service Management Strategy requires a published service standard for air traveller processing. The TPD is committed to examining BWT pressure in the air mode as a result of the recent PIK Evaluation management action plan. Additionally, the policy framework of Bill C-49 (the Transportation Modernization Act) introduces the authority for the Minister of Transport to collect BWT data from the CBSA.
Presently, measuring and reporting Air BWT poses a significant challenge for CBSA staff, due to the introduction of PIK and the lack of a standard BWT measuring and reporting procedure.
PIA T3 has stopped reporting BWT delay incidents (>20mins) this fiscal, as the Bluetooth technology originally used to report BWTs no longer produces reliable results due to kiosk layout (i.e., 11 kiosks in Node C, 10 kiosks in B, and 83 in Customs Hall). At the same time, traveller volume increased 15.9% at this POE in Q1/Q2 from the same period last fiscal, putting BWT at risk.
Vancouver’s BWT Q1/Q2 result (94.1%) is below the annual target. Traveller volumes increased by 18.3% in Q1/Q2 when compared to the same period in FY2016-17, adding resource pressure to the POE. The POE received 5 traveller BWT complaints in Q1/Q2.
Montreal has the largest increase in traveller volume (20.7%) over a 2-year period. While the POE did not report any delay incidents in Q1/Q2, it received 10 traveller BWT complaints, raising questions about the integrity of the BWT reporting.
| 2016-17 Q1 and Q2 |
2017-18 Q1 and Q2 |
2018-19 Q1 and Q2 |
Trend | |
|---|---|---|---|---|
| Pearson T1 | 3 | 3 | 6 | Up |
| Montreal | 16 | 6 | 10 | Up |
| Vancouver | 15 | 6 | 5 | Down |
| Pearson T3 | 3 | 10 | 11 | Up |
| Calgary | 8 | 5 | 3 | Down |
| 2016-17 Q1 and Q2 |
2017-18 Q1 and Q2 |
2018-19 Q1 and Q2 |
|
|---|---|---|---|
| Pearson T1 | 98.5% | 99.4% | 99.9% |
| Montreal | 99.2% | 99.9% | 100.0% |
| Vancouver | 95.9% | 97.1% | 94.1% |
| Pearson T3 | 97% | 99.7% | 100% |
| Calgary | 99.2% | 99.4% | 98.4% |
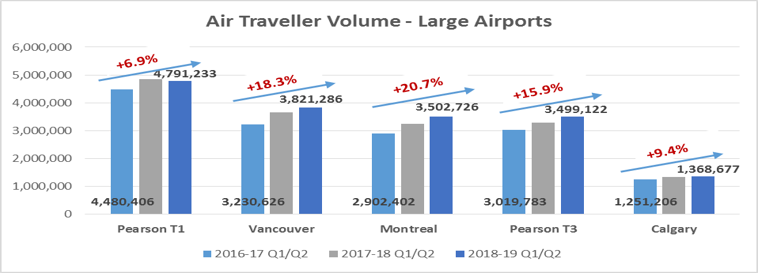
Air traveller volume - Large airports
Long description
This column graph illustrates the trend in air traveller volumes for five large airports for the first two quarters of fiscal year 2016-17 to fiscal year 2018-19. Traveller volumes are presented along the vertical axis, from 0 to 6,000,000. Five airports are listed along the horizontal axis with separate columns for combined Quarter 1 and Quarter 2 data in fiscal year 2016-17, fiscal year 2017-18, and fiscal year 2018-19.
For each airport, traveller volume increased year over year.
- For Pearson International Airport Terminal One, total air traveller volume for Q1 and Q2 were 4,480,406 in 2016-17, 4,851,576 in 2017-18 and 4,791,233 in 2018-19. Over the period, air traveller volume increased by 6.9%
- For Vancouver Airport, total air traveller volume for Q1 and Q2 were 3,230,626 in 2016-17, 3,652,474 in 2017-18 and 3,821,286 in 2018-19. Over the period, air traveller volume increased by 18.3%
- For Pierre Elliott Trudeau International Airport, total air traveller volume for Q1 and Q2 were 2,902,402 in 2016-17, 3,250,930 in 2017-18 and 3,502,726 in 2018-19. Over the period, air traveller volume increased by 20.7%
- For Pearson International Airport Terminal Three, total air traveller volume for Q1 and Q2 were 3,019,783 in 2016-17, 3,291,877 in 2017-18 and 3,499,122 in 2018-19. Over the period, air traveller volume increased by 15.9%
- For Calgary Airport, total air traveller volume for Q1 and Q2 were 1,251,206 in 2016-17, 1,328,376 in 2017-18 and 1,368,677 in 2018-19. Over the period, air traveller volume increased by 9.4%
Consideration / Discussion
- Short-term: TPD, working with Operations, to establish a standard BWT measuring and reporting procedure to ensure data integrity
- Medium-term: TPD, working with stakeholders (e.g., Airport Authorities, Transport Canada) to seek technological solutions to measure BWT in the air mode
Operational Issue/Risk #2: Increased Immigration Facilitation Volume Adding Pressure on CBSA Frontline Resource
Risk Description: High risk
Increased foreign national volumes, combined with increased immigration facilitation activities put enforcement performance at risk.
Findings
Traveller Air Program experienced the most significant increase in resource pressure over the last 5 years. While the program has maintained its performance targets with a relatively flat budget, this has been sustained largely by process improvements (e.g., from PIL to PIK), and resource prioritization within the program (e.g., from Secondary to Primary, from enforcement activities to facilitation activities).
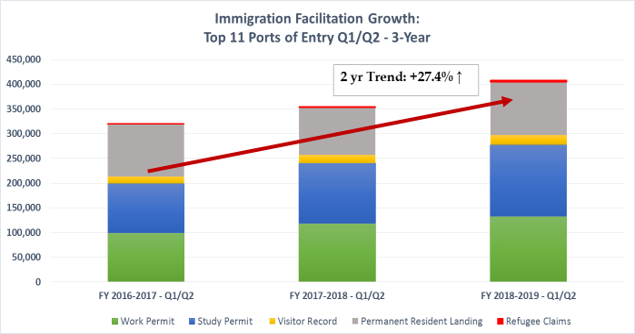
In particular, at the top 11 air ports of entry (POEs), immigration facilitation activitiesFootnote 1 increased 27.4% in 2 years. While volume growth is observed in all facilitation activities, asylum claims and study permits saw the largest increase (153.7% and 45.2% respectively).
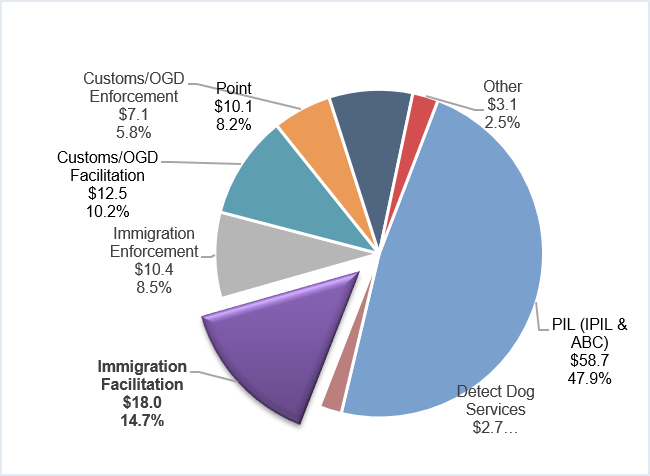
A Resource Allocation Model (RAM)-based costing analysis shows that the Agency spent nearly $18 million on immigration facilitation activities in FY2016-17 at the top 11 air POEs, the highest among all secondary functions and nearly 15% of the total traveller operating budget. Given the increase in immigration facilitation volume, an even bigger share of the operating budget is expected for this fiscal.
Immigration, Refugee and Citizenship Canada implemented the Global Skills Strategy last year, and launched the Student Direct Stream in June this year to facilitate study permit applications from China, India, the Philippines and Vietnam. These initiatives, while beneficial to Canadian Economy, will continue putting pressure on CBSA’s frontline operation, as POE issuance of work/study permits remains a resource intensive administrative process.
Immigration facilitation growth: Top 11 Ports of Entry Quarter 1 and Quarter 2 - 3-year
Long description
This column graph illustrates the trend in immigration facilitation growth at the top 11 air ports of entry for the first two quarters of fiscal year 2016-17 to fiscal year 2018-19. Volumes of results are presented along the vertical axis, from 0 to 450,000. Fiscal year 2016-17, fiscal year 2017-18, and fiscal year 2018-19 are listed along the horizontal axis with data for Quarter 1 and Quarter 2 combined. For each year, a stacked column is presented with volumes for Work Permits, Study Permits, Visitor Records, Permanent Resident Landings and Refugee Claims.
Total facilitation results increased year over year, with an overall increase of 27.4% from fiscal year 2016-17 to fiscal year 2018-19.
- For fiscal year 2016-17, there were 43,836 Work Permits, 83,842 Study Permits, 8,928 Visitor Records, 49,809 Permanent Resident Landings, and 782 Refugee Claims
- For fiscal year 2017-18, there were 53,312 Work Permits, 98,208 Study Permits, 10,315 Visitor Records, 44,731 Permanent Resident Landings, and 973 Refugee Claims
- For fiscal year 2018-19, there were 62,635 Work Permits, 112,123 Study Permits, 11,953 Visitor Records, 50,729 Permanent Resident Landings, and 1,747 Refugee Claims
Fiscal year 2016-17 costing allocation: Top 11 Air ports of entrys (in millions)
Long description
This pie chart illustrates the costing allocation in millions of dollars for various activities at the top 11 air ports of entry for fiscal year 2016-17.
- For Primary Inspection Line, (IPIL and ABC), $58.7 million for 47.9% of the total
- For Detector Dog Services, $2.7 million for 2.2% of the total
- For Immigration Facilitation, $18.0 million for 14.7% of the total
- For Immigration Enforcement, $10.4 million for 8.5% of the total
- For Customs and OGD Facilitation, $12.5 million for 10.2% of the total
- For Customs and OGD Enforcement, $7.1 million for 5.8% of the total
- For Point, $10.1 million for 8.2% of the total
- For Other, $3.1 million for 2.5% of the total
Consideration / Discussion
Are there ways to reduce the impact of immigration facilitation volume as cost factor through process improvements, automation, and OGD collaboration?
Operational Issue/Risk #3: Roving Data Reporting Issues Preventing Performance Evaluation
Risk Description: Work in progress
BSO time spent on roving is not always reported using roving activity type; roving referrals and results are not entered in ICS-Secondary Processing (SP) and ICES as required, preventing performance analysis of roving function.
Findings
The roving function provides a valuable risk-mitigation process to the Primary Inspection Kiosk operation model. To enable integrated roving performance reporting, the TPD, working jointly with Traveller Operations, developed a detailed Closing the Loop reporting procedure and created a new roving activity type in March 2018.
The first quarterly (Q1) roving performance report released in July highlighted various data entry issues/gaps. Over the course of Q2, the TPD, Traveller Operations, and regions worked diligently through PIK regional working group sessions to resolve these issues.
While all POEs reported rover referrals (chart below) in Q2, data entry improvements are required in the following areas:
- activity report does not fully reflect BSO time spent on roving (e.g., [redacted] only reported 9 hrs. in Q1/Q2, [redacted] enforcement costing centre reported 10,791 roving hours);
- rover referrals are not always entered in SP, resulting in unrealistic BSO hrs. per referral (e.g., [redacted] 12.32 hrs. per referral)
- rover referral enforcement results are not fully captured in ICES (e.g., only 85 enforcement results can be attributable to rover referrals at [redacted])
| Rover Referrals | Enforcement Results | Resultant Rate | Activity Report (hrs) | Number of BSO hrs per Referral | |
|---|---|---|---|---|---|
| [redacted] | 3,306 | 368 | 11.1% | 2,283.1 | 0.69 |
| [redacted] | 10,791.0 | N/A | |||
| [redacted] | 975 | 391 | 40.1% | 12,009.8 | 12.32 |
| [redacted] | 550 | 85 | 15.5% | 5,155.2 | 9.37 |
| [redacted] | 389 | 23 | 5.9% | 87.0 | 0.22 |
| [redacted] | 519 | 27 | 5.2% | 9.0 | 0.02 |
| [redacted] | 576 | 52 | 9.0% | 2,501.5 | 4.34 |
| [redacted] | 27 | 3 | 11.1% | 915.0 | 33.89 |
| [redacted] | 12 | 1 | 8.3% | - | 0.00 |
| [redacted] | 46 | 2 | 4.3% | 1,405.0 | 30.54 |
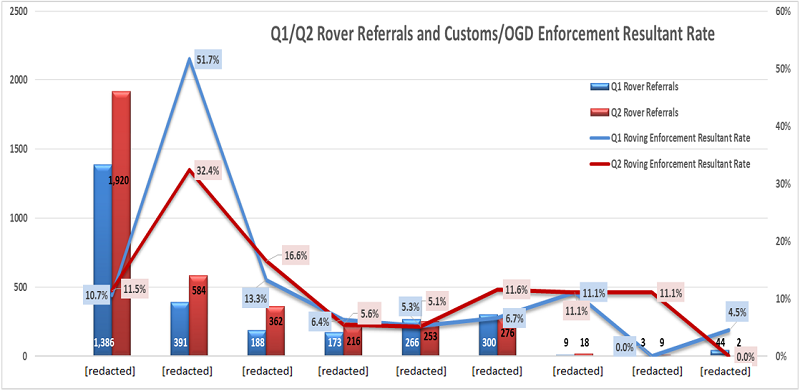
Quarter 1 and quarter 2 rover referrals and customs/OGD enforcement resultant rate
Long description
This combined line and column graph illustrates the volume of rover referrals and the roving enforcement resultant rate for nine airports for the first two quarters of fiscal year 2018-19. Volumes are presented along the primary vertical axis from 0 to 2,500. Percentages are presented along the secondary vertical axis from 0% to 60%. Nine airports are listed along the horizontal axis with separate columns for Quarter 1 and Quarter 2 rover referral data, and two points along the line graph for Quarter 1 and Quarter 2 roving enforcement resultant rates.
- For [redacted], there were 1386 rover referrals in Q1 and 1920 rover referrals in Q2; the roving enforcement resultant rate was 10.7% in Q1 and 11.5% in Q2
- For [redacted], there were 391 rover referrals in Q1 and 584 rover referrals in Q2; the roving enforcement resultant rate was 51.7% in Q1 and 32.4% in Q2
- For [redacted], there were 188 rover referrals in Q1 and 362 rover referrals in Q2; the roving enforcement resultant rate was 13.3% in Q1 and 16.6% in Q2
- For [redacted], there were 173 rover referrals in Q1 and 216 rover referrals in Q2; the roving enforcement resultant rate was 6.4% in Q1 and 5.6% in Q2
- For [redacted], there were 266 rover referrals in Q1 and 253 rover referrals in Q2; the roving enforcement resultant rate was 5.3% in Q1 and 5.1% in Q2
- For [redacted], there were 300 rover referrals in Q1 and 276 rover referrals in Q2; the roving enforcement resultant rate was 6.7% in Q1 and 11.6% in Q2
- For [redacted], there were 9 rover referrals in Q1 and 18 rover referrals in Q2; the roving enforcement resultant rate was 11.1% in Q1 and 11.1% in Q2
- For [redacted], there were 3 rover referrals in Q1 and 9 rover referrals in Q2; the roving enforcement resultant rate was 0.0% in Q1 and 11.1% in Q2
- For [redacted], there were 44 rover referrals in Q1 and 2 rover referrals in Q2; the roving enforcement resultant rate was 4.5% in Q1 and 0.0% in Q2
Consideration and next steps:
- Traveller Operations to pursue targeted efforts to strengthen data entry at POEs
- TPD to perform issue diagnosis and to continue monitoring progress
- TPD to conduct a time and motion study to assess the resources required for roving and update airport RAMs
- Date modified: