
ARCHIVED - Canada Border Services Agency Quarterly Financial Report
For the quarter ended June 30, 2014
Archived Content
Information identified as archived is provided for reference, research or recordkeeping purposes. It is not subject to the Government of Canada Web Standards and has not been altered or updated since it was archived. Please contact us to request a format other than those available.
1. Introduction
This quarterly financial report (QFR) has been prepared as required by section 65.1 of the Financial Administration Act and in the form and manner prescribed by the Treasury Board. This quarterly report should be read in conjunction with the Main Estimates, Supplementary Estimates A, as well as Canada's Economic Action Plan 2012 (Budget 2012), Canada's Economic Action Plan 2013 (Budget 2013) and Canada's Economic Action Plan 2014 (Budget 2014).
A summary description of the Canada Border Services Agency (CBSA) program activities can be found in Part II of the Main Estimates, and a detailed description in Part III – Report on Plans and Priorities.
1.1 Basis of Presentation
This QFR has been prepared using an expenditure basis of accounting. The accompanying Statement of Authorities (Table 1) includes the CBSA's spending authorities granted by Parliament and those used by the Agency, consistent with the 2013-2014 and 2014-2015 Main Estimates and Supplementary Estimates A.
Parliamentary spending authority is required before monies can be spent by the Government. Approvals are given in the form of approved limits through appropriation acts or through other legislation providing statutory spending authority for specific purposes.
When Parliament is dissolved for the purposes of a general election, section 30 of the Financial Administration Act authorizes the Governor General, under certain conditions, to issue a special warrant authorizing the Government to withdraw funds from the Consolidated Revenue Fund. A special warrant is deemed to be an appropriation for the fiscal year in which it is issued.
The CBSA uses the full accrual method of accounting to prepare and present its annual departmental financial statements that are part of the departmental performance reporting process. However, the spending authorities voted by Parliament remain on an expenditure basis.
The QFR has not been subjected to an external audit or review.
1.2 Financial Structure
The CBSA has a financial structure composed of voted budgetary authorities that include Vote 1 Operating Expenditures and Vote 5 Capital Expenditures, while the statutory authorities consist mainly of contributions to the employee benefit plans.
In addition, the Agency has the authority from Parliament to expend certain revenues that it receives in a fiscal year through the conduct of its operations to offset expenditures that it incurs in that fiscal year. As a result of this respendable authority, some of the Agency's programs are partially funded through User Fees (e.g. Nexus).
The CBSA currently operates on the basis of a two-year appropriation, whereby any unused spending authority at the end of a fiscal year is available to be used the following year. However, any portion of the spending authority not used at the end of the second year is lapsed.
2. Highlights of Fiscal Quarter and Fiscal Year-to-Date (YTD) Results
This section highlights the significant items that contributed to the net increase or decrease in resources available for the year and actual expenditures as of the quarter ended December 31, 2013.
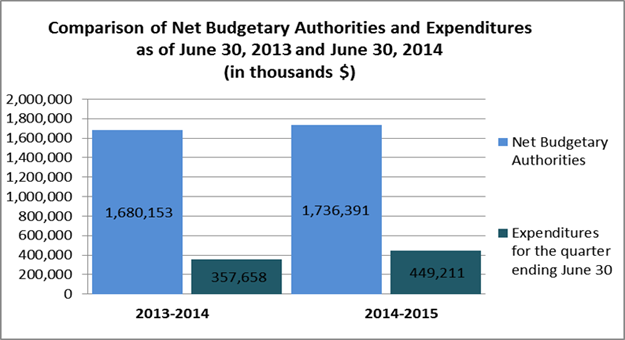
Graph 1 - Comparison of Net Budgetary Authorities and Expenditures as of June 30, 2013 and June 30, 2014 (in thousands $)
| 2013–2014 | 2014–2015 | |
|---|---|---|
| Net Budgetary Authorities | 1,680,153 | 1,736,391 |
| Expenditures for the quarter ending June 30 | 357,658 | 449,211 |
2.1 Significant Changes to Authorities
For the period ending June 30, 2014, the authorities provided to the CBSA are comprised of the Main Estimates only, the same as for the period ending June 30, 2013.
As at June 30, 2014, the Statement of Authorities (Table 1) reflects total authorities available of $1,736.4 million, compared to $1,680.2 million at the same quarter last year. The result is a net increase of $56.2 million or 3% in authorities. Detailed highlights of the major increases and decreases can be found in the 2014-2015 Main Estimates.
The Agency's Vote 1 Operating Expenditures increased slightly by $1.3 million or 0.1%, which is mainly attributed to the net effect of the following significant items:
- Increases totaling $103.1 million mainly due to:
- An increase of $63.1 million in funding for projects such as Arming, E‑Manifest and Refugee Reform due to a reprofile of unspent 2013-2014 funding transferred to 2014-2015;
- An increase of $32.0 million of funding for initiatives included in the Beyond the Border Action Plan such as the modernization of Border Infrastructure, the development of a Single Window approach, and the Entry-Exit initiative; and
- An increase of $2.1 million for collective agreements.
- Decreases totaling $101.8 million mainly due to:
- A further decrease of $62.8 million as compared to last year related to the Budget 2012 Deficit Reduction Action Plan (last phase);
- A decrease of $23.0 million due to the transfer of responsibility to Shared Services Canada (SSC) for expenditures related to End User Devices (software) and the Shared Infrastructure Platform; and
- A decrease of $8.4 million due to the realignment of the Agency's salary envelope which resulted in a conversion of operating funds to salary funds.
The Agency's Vote 5 Capital Expenditures increased by $57.5 million or 55%, which is mainly attributed to the net effect of the following significant items:
- Increases totaling $74.3 million mainly due to:
- An increase of $50.1 million of funding for the initiatives included in the Beyond the Border Action Plan such as the modernization of Border Infrastructure, the development of a Single Window approach, the Entry-Exit initiative, the Integrated Cargo Security Initiative, and the Interactive Advance Passenger Initiative;
- An increase of $18.9 million due to a reprofile of 2013-2014 unspent capital funding transferred to 2014-2015 mainly for the Field Operations Support System replacement; and
- A net increase of $5.3 million in funding for the Lacolle Commercial Expansion (increase of $7.3 million due to a reprofile of 2013-2014 unspent funding transferred to 2014-2015 and a decrease of $2.0 million in funding requirements as compared to last year).
- Decreases totaling $16.7 million mainly due to:
- A net decrease of $13.5 million in funding requirements for detection equipment (increase of $8.4 million due to the reprofile of 2013-2014 unspent funding transferred to 2014-2015 and a decrease of $21.9 million in funding requirements for detection equipment); and
- A net decrease of $3.1 million in funding for projects such as the CBSA Assessment and Revenue Management (CARM) initiative and the Postal Modernization initiative (increase of $17 million due to the reprofile of 2013-2014 unspent funding transferred to 2014-2015 and a decrease of $20.1 million in funding requirements).
The Agency's Statutory Authority related to the employee benefit plan decreased by $2.6 million, or 1.4% from the previous year.
2.2 Explanations of Significant Variances in Expenditures from Previous Year
The Statement of Authorities (Table 1) indicates an increase of $86.9 million or 28% in Vote 1 Operating Expenditures used during the quarter ended June 30, 2014 - $395.3 million as compared to $308.4 million last year. $38 million of the increase can be attributed to the Government of Canada's one-time transitional payment as it moves to a pay-in-arrears pay system, while the remainder is mainly due to severance payouts as a result of the recently signed collective agreement for Border Services Officers (FB classification).
The Vote 5 Capital Expenditures increased by $5.4 million or 126% - $9.7 million this quarter as compared to $4.3 million in the 1st quarter last year. The increase is mainly due to the CBSA's adoption of the new Treasury Board of Canada Secretariat's common definition of a capital expenditures vote. As per this new definition, any expenditure related to the creation of or purchase of capital assets must be charged to a capital vote. In the past, capital assets could be created using Vote 1 Operating Expenditures, as long as the Treasury Board Accounting Standard (TBAS) 3.1 and CBSA's Accounting Policy for Capital Assets were applied.
The Departmental Budgetary Expenditures by Standard Object (Table 2)indicates an increase in gross budgetary expenses incurred during the 1st quarter of $92 million or 26%, $451.4 million in 2014-2015 compared to $359.4 million in 2013-2014. Expenses during the quarter represent 26% of planned expenditures as compared to 21% in 2013-2014.
The most notable variances by standard object from the 1st quarter last year to this year are as follows:
- Increase of $56.5 million in salary expenditures mainly due to severance payouts as a result of the recently signed collective agreement for Border Services Officers (FB classification);
- Increase of $39.2 million in other subsidies and payments mainly due to the $38 million one-time transition payment for implementing salary payment in arrears by the Government of Canada;
- Increase of $1.2 million in the acquisition of land, building and works due to an increase in assets under construction for buildings;
- Decrease of $2.1 million in the acquisition of machinery and equipment due to the incorrect processing of an invoice that will be corrected in a subsequent period; and
- Decrease of $1.3 million in repair and maintenance due to expenditures for repair and maintenance in the 1st quarter last year that were not required in the 1st quarter this year.
The planned revenue from the sales of services reflects the Agency's revenue respending authority which has increased from $12.13 million in 2013-2014 to $16.4 million in 2014-2015. The revenue from the sales of services collected in the quarter are up by $0.5 million or 29% ($2.2 million as compared to $1.7 million in 2013-2014) due to the timing in the collection of payments and volume increases in the Nexus program.
3. Risks and Uncertainties
The complexity of the operating environment of the CBSA can be seen in the broad scope of external drivers. Developments in the global economy cascade down into Canada's trade, immigration, tourism and refugee patterns, affecting volumes and introducing security and facilitation challenges. Continued growth in both global trade and the virtual economy has benefitted legitimate business and criminal enterprises alike, and presents more complexity in managing Canada's supply chain and physical borders. Similarly, the rapid evolution of technology presents opportunities for the fortification of border controls and identity verification, but it also presents opportunities to circumvent border controls for those who are so inclined.
In considering these factors, the CBSA has embarked on various initiatives, including those identified in the Beyond the Border Action Plan, that will allow the organization to be even more efficient and effective in the way it does business through increased efforts to address threats early and facilitate trade and travel.
To improve its ability to successfully deliver on its initiatives, the Agency regularly examines its enterprise risk landscape, the results of which are published in the CBSA Enterprise Risk Profile (ERP). The ERP identifies and ranks the top risks to the Agency's strategic outcome and undergoes a full revision every two years. Risks are divided into one of two categories: business risks and enabler risks. Business risks are the risks that the Agency is mandated to address on behalf of Canada (e.g. contraband, irregular migration, etc.) while enabler risks are risks to the Agency's ability to deliver on its mandate (e.g. risks related to human resources, information technology, etc.).
The most recent full revision to the ERP occurred in spring 2013, while an ERP Risk Status Update was developed in spring 2014. The Risk Status Update provides an update on the progress of mitigation activities, identifies significant changes observed in the environment over the past 12 months, as well as risk trend information indicating whether exposure to a given risk has increased, decreased, or remained the same. While exposure to the Agency's business risks has remained relatively stable, several of the Agency's enabler risks were assessed as having decreased slightly in severity. This reduction in exposure is attributable to progress made in mitigation activities over the past 12 months and to positive effects starting to be felt as a result of controls implemented prior to the 2013 ERP.
4. Significant Changes in Relation to Operations, Personnel and Programs
4.1 Key Senior Personnel
On May 20, 2014, Ms. Nada Semaan joined the Agency as the Executive Vice-President, replacing Mr. Malcolm Brown who was appointed as the Deputy Minister of the Canadian International Development Agency.
4.2 Operations
In addition to the Agency's Report on Plans and Priorities (RPP) priorities, the Agency is pursuing its Transformation Agenda driven by both the Beyond the Border Action Plan and Blueprint 2020, complemented by Border Modernization. While there have been no significant changes in relation to the Agency's operations, some changes have occurred in the organizational structure. This has resulted in the establishment of the Trade and Anti-Dumping Programs directorate, as well as realignment and consolidation of several other directorates.
Budget 2014 announced an immediate increase to the rates of excise duty applicable to tobacco products to account for a decade of inflation, as well as permanently eliminated tariffs on mobile offshore drilling units used in offshore oil and gas exploration and development on or after May 5, 2014. While both announcements resulted in numerous systems changes to ensure the appropriate duty and tariff rates are being assessed, there was no effect on CBSA operations to travellers and commercial goods.
4.3 New Programs
There have been no significant changes in relation to programs. The Agency continues to play an instrumental role in implementing the Beyond the Border Action Plan initiatives as announced by the Prime Minister and the U.S. President in December 2011. This Action Plan provides a practical road map for speeding up legitimate trade and travel. The CBSA is leading ten initiatives, plays a key supporting role in nine initiatives, and has an interest in another nine initiatives.
4.4 Budget 2012 Implementation
This section provides an overview of the savings measures announced in Budget 2012 that are being implemented in order to refocus government and programs: make it easier for Canadians and business to deal with their government and to modernize and reduce the back office operations.
The CBSA has achieved its Budget 2012 ongoing savings of $143.4 million starting in fiscal year 2014-2015 through efficiency measures by restructuring, modernizing programs and transforming business practices in selected areas by introducing following savings measures:
- a streamlined and simplified its approach to internal services through the use of more technology and less cumbersome processes;
- the optimization of programs to get better results at reduced costs;
- the transformation of programs in order to eliminate red tape, provide better services to Canadians and reduce costs; and
- the adjustment of front-line service delivery where adjustments can be made without impacting service levels.
The Budget 2012 initiatives enabled the CBSA to focus and align resources to its key priorities and core mandate. The CBSA is committed to meeting current and future security and service requirements to serve Canadians and provide them with a modern, dynamic border.
The impacts of Budget 2012 have been reflected in the financial information for the 1st quarter and the budgets and expenditures have been reduced accordingly. Supplementary data on Budget 2012 savings by program activity is included in Table 3.
5. Approval by Senior Officials
Approved by:
Luc Portelance
President
Ottawa, Canada
Date: August 14, 2014
Claude Rochette
Chief Financial Officer
Date: August 11, 2014
6. Table 1: Statement of Authorities (Unaudited)
| Total available for use for the year ending March 31, 2015* | Used during the quarter ended June 30, 2014 | Year-to-date used at quarter end | |
|---|---|---|---|
| Vote 1 - Net Operating Expenditures | 1,397,915 | 395,261 | 395,261 |
| Vote 5 - Capital Expenditures | 161,906 | 9,725 | 9,725 |
| Statutory Authority - Contributions to employee benefit plans | 176,570 | 44,142 | 44,142 |
| Statutory Authority - Refunds of amounts credited to revenues in previous years | 0 | 41 | 41 |
| Statutory Authority - Spending of proceeds from the disposal of surplus Crown assets | 0 | 42 | 42 |
| Total budgetary authorities | 1,736,391 | 449,211 | 449,211 |
| Non-budgetary authorities | 0 | 0 | 0 |
| Total authorities | 1,736,391 | 449,211 | 449,211 |
Note: Numbers may not add and may not agree with details provided elsewhere due to rounding.
* Includes only Authorities available for use and granted by Parliament at quarter end.
| Total available for use for the year ending March 31, 2014* | Used during the quarter ended June 30, 2013 | Year-to-date used at quarter end |
|
|---|---|---|---|
| Vote 1 - Net Operating Expenditures | 1,396,653 | 308,361 | 308,361 |
| Vote 5 - Capital Expenditures | 104,335 | 4,346 | 4,346 |
| Statutory Authority - Contributions to employee benefit plans | 179,164 | 44,791 | 44,791 |
| Statutory Authority - Refunds of amounts credited to revenues in previous years | 0 | 15 | 15 |
| Statutory Authority - Spending of proceeds from the disposal of surplus Crown assets | 0 | 145 | 145 |
| Total budgetary authorities | 1,680,153 | 357,658 | 357,658 |
| Non-budgetary authorities | 0 | 0 | 0 |
| Total authorities | 1,680,153 | 357,658 | 357,658 |
Note: Numbers may not add and may not agree with details provided elsewhere due to rounding.
* Includes only Authorities available for use and granted by Parliament at quarter end.
7. Table 2: Departmental Budgetary Expenditures by Standard Object (Unaudited)
| Planned expenditures for the year ending March 31, 2015 * | Expended during the quarter ended June 30, 2014 | Year-to-date used at quarter end |
|
|---|---|---|---|
| Expenditures | |||
Personnel |
1,246,693 | 357,484 | 395,426 |
Transportation and communications |
53,488 | 7,255 | 7,255 |
Information |
1,407 | 339 | 339 |
Professional and special services |
223,079 | 38,595 | 38,595 |
Rentals |
24,526 | 1,730 | 1,730 |
Repair and maintenance |
23,119 | 3,161 | 3,161 |
Utilities, materials and supplies |
19,657 | 2,252 | 2,252 |
Acquisition of land, buildings and works |
41,427 | 1,570 | 1,570 |
Acquisition of machinery and equipment |
104,024 | 368 | 368 |
Transfer payments |
- | - | 0 |
Other subsidies and payments |
15,401 | 38,636 | 694 |
| Total gross budgetary | 1,752,821 | 451,390 | 451,390 |
| Less revenues netted against expenditures | |||
Sales of Services |
16,430 | 2,220 | 2,220 |
Other Revenue |
0 | -41 | -41 |
| Total revenues netted against expenditures | 16,430 | 2,179 | 2,179 |
| Total net budgetary expenditures | 1,736,391 | 449,211 | 449,211 |
Note: Numbers may not add and may not agree with details provided elsewhere due to rounding.
* Includes only Authorities available for use and granted by parliament at quarter-end.
| Planned expenditures for the year ending March 31, 2014 * | Expended during the quarter ended June 30, 2014 | Year-to-date used at quarter end | |
|---|---|---|---|
| Expenditures | |||
Personnel |
1,208,843 | 301,010 | 301,010 |
Transportation and communications |
61,147 | 7,770 | 7,770 |
Information |
1,293 | 476 | 476 |
Professional and special services |
267,230 | 39,456 | 39,456 |
Rentals |
8,759 | 1,728 | 1,728 |
Repair and maintenance |
24,275 | 4,449 | 4,449 |
Utilities, materials and supplies |
20,163 | 2,211 | 2,211 |
Acquisition of land, buildings and works |
31,727 | 337 | 337 |
Acquisition of machinery and equipment |
60,713 | 2,474 | 2,474 |
Transfer payments |
0 | 0 | 0 |
Other subsidies and payments |
8,132 | -542 | -542 |
| Total gross budgetary expenditures | 1,692,283 | 359,369 | 359,369 |
| Less revenues netted against expenditures | |||
Sales of Services |
12,130 | 1,726 | 1,726 |
Other Revenue |
0 | -15 | -15 |
| Total revenues netted against expenditures | 12,130 | 1,711 | 1,711 |
| Total net budgetary expenditures | 1,680,153 | 357,658 | 357,658 |
Note: Numbers may not add and may not agree with details provided elsewhere due to rounding.
* Includes only Authorities available for use and granted by Parliament at quarter-end.
8. Table 3: Departmental Budget 2012 Planned Savings by Program (Unaudited)
| Program | 2012-2013 | 2013-2014 | 2014-2015 & Ongoing* |
|---|---|---|---|
| Risk Assessment | 5,452 | 10,168 | 11,209 |
| Admissibility Determination | 7,254 | 21,170 | 31,194 |
| Criminal Investigations | 15 | 73 | 118 |
| Immigration Enforcement | 103 | 1,152 | 3,432 |
| Secure and Trusted Partnerships | 158 | 327 | 7,706 |
| Revenue and Trade Management | 1,753 | 3,994 | 9,816 |
| Recourse | 129 | 302 | 609 |
| Internal Services | 16,415 | 35,594 | 79,323 |
| Total for CBSA | 31,279 | 72,780 | 143,407 |
Note: Numbers may not add and may not agree with details provided elsewhere due to rounding.
* includes statutory employee benefit plan savings
- Date modified: