Common menu bar links
ARCHIVED - National Administrative Monetary Penalty (AMPS) Statistics
 This page has been archived.
Archived Content
Information identified as archived is provided for reference, research or recordkeeping purposes. It is not subject to the Government of Canada Web Standards and has not been altered or updated since it was archived. Please contact us to request a format other than those available.
January 2009 to December 2011
Table of Contents
- Introduction
- AMPS Contraventions by Client Type
- Table 1: Penalty Assessments, Net Volume and Penalty Amount of Contraventions by Client Type, and Total Number of Penalty Assessments, Net Volume of Contraventions and Total Penalty Amounts for all Report Periods
- Chart 1: Net Volume of Contraventions and Penalty Assessments
- Chart 2: Net Volume of Contraventions by Client Type
- Chart 3: Net Penalty Amount of Contraventions by Client Type
- AMPS Contraventions by Penalty Level
- AMPS Contraventions by Client Type and Penalty Level
- AMPS Top 10 Contraventions
- AMPS Top 10 Trade Contraventions
- AMPS Top 10 Border Contraventions
- AMPS Top 10 Importer/Exporter Contraventions
- AMPS Top 10 Carrier Contraventions
- AMPS Top 10 Warehouse Operator Contraventions
- AMPS Appeals
Introduction
The following tables provide statistical information about the Administrative Monetary Penalty System (AMPS) penalties issued from January 2009 to December 2011. Volumes and penalty amounts have been calculated for each six-month period in order to provide the most up-to-date numbers. They may vary slightly from previously published amounts as the result of appeals having been decided.
Contravention C244 is not included since this is a systems-generated warning for Customs Self Assessment (CSA) clients. All figures, both net volumes and penalty amounts, are for all contraventions issued, minus those that were cancelled. In other words, cancelled penalties are excluded in the calculation of statistics.
Data have been analyzed by client type, penalty levels, top contraventions and appeals data. All penalty amounts and values are in Canadian dollars. All tables and charts cover the time period from January 2009 to December 2011.
Some of the charts are stacked area charts. They are used to show multiple series stacked on top of each other. Series can be client types, penalty levels or contravention codes. In this way, they display totals for all series, the proportion that each series contributes to the total as well as the total net volume or penalty amount. In some of the charts, a small pie chart is inserted into the top right-hand corner and depicts the proportion of the series values for the entire time period. Specific values related to these pie charts are located in the legend.
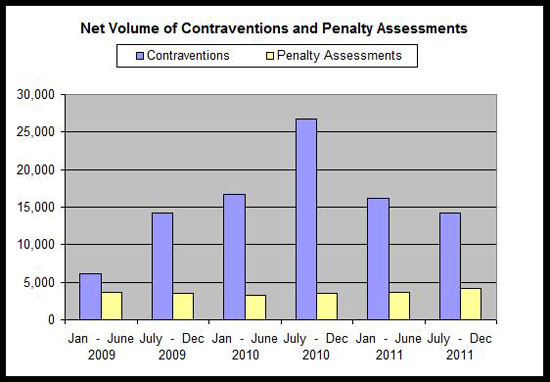
Chart 1 shows the number of penalty assessments in comparison to the net volume of contraventions. It is important to use the number of penalty assessments, rather than the net volume of contraventions, when determining how many clients are penalized. The reason is that each penalty assessment can result in more than one contravention.
To learn more about each contravention, including penalty structures, basis and legislation, consult the Master Penalty Document.
AMPS Contraventions by Client Type
The following table and charts provide a biannual summary of the net volume of contraventions and penalty amounts issued per client type. The statistics identify three main client types: importers, carriers and warehouse operators. In all the tables, any data captured for importers also take into account exporters. A specific percentage figure of exporters versus importers cannot be determined at this time. Chart 1 illustrates the percentage of all contraventions issued (net) by client type between January 2009 and December 2011. For example, importers accounted for 92.83 percent of all AMPS contraventions issued, carriers for 5.35 percent and warehouse operators for 1.82 percent. These figures correspond to those in Table 1.
Table 1: Penalty Assessments, Net Volume and Penalty Amount of Contraventions by Client Type
#PA= # of Penalty assessments, v = Volume, p = Penalty amount
| Reporting Period | Importers | Carriers | Warehouse Operators | TOTAL | |
|---|---|---|---|---|---|
| Jan-June 2009 | #PA | 2,749 | 706 | 149 | 3,604 |
| v | 5,048 | 905 | 159 | 6,112 | |
| p | $1,756,535.02 | $881,003.58 | $318,897.05 | $2,956,435.65 | |
| July-Dec 2009 | #PA | 2,689 | 696 | 148 | 3,553 |
| v | 12,997 | 944 | 216 | 14,157 | |
| p | $1,862,673.54 | $1,034,149.14 | $295,837.55 | $3,192,660.23 | |
| Jan-June 2010 | #PA | 2,487 | 581 | 153 | 3,221 |
| v | 15,515 | 805 | 364 | 16,684 | |
| p | $2,238,667.48 | $999,093.80 | $320,066.92 | $3,557,828.20 | |
| July-Dec 2010 | #PA | 2,858 | 523 | 163 | 3,544 |
| v | 25,725 | 708 | 332 | 26,765 | |
| p | $2,133,722.39 | $1,057,325.00 | $304,900.00 | $3,495,947.39 | |
| Jan-June 2011 | #PA | 2,989 | 483 | 143 | 3,615 |
| v | 15,175 | 609 | 372 | 16,156 | |
| p | $2,021,675.00 | $1,012,425.00 | $245,550.00 | $3,279,650.00 | |
| July-Dec 2011 | #PA | 3,088 | 859 | 230 | 4,177 |
| v | 12,935 | 1,068 | 271 | 14,274 | |
| p | $2,055,412.91 | $1,604,125.00 | $524,350.00 | $4,183,887.91 |
Total Number of Penalty Assessments, Net Volume of Contraventions and Total Penalty Amounts for all Report Periods
| Importers | % | Carriers | % | Warehouse Operators | % | Total | |
|---|---|---|---|---|---|---|---|
| #PA | 16,896 | 77.75 | 3,849 | 17.71 | 986 | 4.54 | 21,731 |
| v | 87,395 | 92.83 | 5,039 | 5.35 | 1,714 | 1.82 | 94,148 |
| p | $12,068,686.34 | 58.40 | $6,588,121.52 | 31.88 | $2,009,601.52 | 9.72 | $20,666,409.38 |


AMPS Contraventions by Penalty Level
Table 2 provides a biannual summary of the net volume of contraventions and penalty amounts issued per penalty level. Percentages illustrate the portion of total volume of contraventions issued and penalty amounts (net) for each penalty level. For example, 96.68 percent of all contraventions issued (excluding C244 and cancelled penalties) are issued at Level 1 and only 1.76 percent are at Level 2. At the third level, a total of 1.53 percent of all contraventions are issued. However, this accounts for 16.61 percent of the total value of penalties issued since Level 3 penalties are at a higher/escalated penalty amount, given that the AMPS structure is graduated in most cases.
Table 2: Net Volume and Penalty Amount of Contraventions by Penalty Level
v = Volume, p = Penalty amount
| Reporting Period | Level 1 | Level 2 | Level 3 | Level 4 | TOTAL | |
|---|---|---|---|---|---|---|
| Jan-June 2009 | v | 5,410 | 399 | 302 | 1 | 6,112 |
| p | $2,105,586.41 | $351,718.09 | $498,676.12 | $455.03 | $2,956,435.65 | |
| July-Dec 2009 | v | 13,334 | 425 | 394 | 4 | 14,157 |
| p | $2,368,047.46 | $284,902.00 | $536,664.41 | $3,046.36 | $3,192,660.23 | |
| Jan-June 2010 | v | 16,307 | 240 | 135 | 2 | 16,684 |
| p | $2,943,389.80 | $251,766.06 | $361,015.74 | $1,656.60 | $3,557,828.20 | |
| July-Dec 2010 | v | 26,461 | 199 | 105 | 0 | 26,765 |
| p | $2,857,997.39 | $224,400.00 | $413,550.00 | $0.00 | $3,495,947.39 | |
| Jan-June 2011 | v | 15,826 | 198 | 124 | 8 | 16,156 |
| p | $2,673,500.00 | $207,050.00 | $374,100.00 | $25,000.00 | $3,279,650.00 | |
| July-Dec 2011 | v | 13,683 | 199 | 384 | 8 | 14,274 |
| p | $2,550,462.91 | $210,125.00 | $1,248,300.00 | $175,000.00 | $4,183,887.91 |
| Penalty | Jan 2009 - Dec 2011 | % of | Jan 2009 - Dec 2011 | % of |
|---|---|---|---|---|
| Levels | Volume | Total | Penalty amount | Total |
| Level 1 | 91,021 | 96.68 | $15,498,983.97 | 75.00 |
| Level 2 | 1,660 | 1.76 | $1,529,961.15 | 7.40 |
| Level 3 | 1,444 | 1.53 | $3,432,306.27 | 16.61 |
| Level 4 | 23 | 0.02 | $205,157.99 | 0.99 |
| TOTAL | 94,148 | 100.00 | $20,666,409.38 | 100.00 |


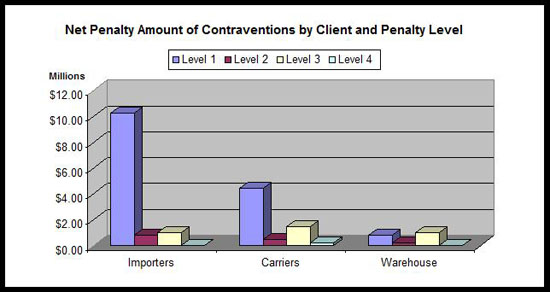
AMPS Contraventions by Client Type and Penalty Level
The following table and charts provide a summary of the net volume of contraventions and penalty amounts issued per penalty level and client type for the January 2009 to December 2011 report period. Percentages illustrate the portion of total volume of contraventions issued and penalty amounts (net) at each penalty level and client type.
Table 3: Net Volume and Penalty Amount of Contraventions by Client Type and Penalty Level
v = Volume, p = Penalty amount
| Level | Importers | % | Carriers | % | Warehouse | % | Total | |
|---|---|---|---|---|---|---|---|---|
| 1 | v | 85,585 | 94.03 | 4,169 | 4.58 | 1,267 | 1.39 | 91,021 |
| p | $10,272,622.81 | 66.28 | $4,426,046.52 | 28.56 | $800,314.64 | 5.16 | $15,498,983.97 | |
| 2 | v | 1,214 | 73.13 | 344 | 20.72 | 102 | 6.14 | 1,660 |
| p | $816,736.88 | 53.38 | $498,525.00 | 32.58 | $214,699.27 | 14.03 | $1,529,961.15 | |
| 3 | v | 589 | 40.79 | 510 | 35.32 | 345 | 23.89 | 1,444 |
| p | $974,168.66 | 28.38 | $1,463,550.00 | 42.64 | $994,587.61 | 28.98 | $3,432,306.27 | |
| 4 | v | 7 | 30.43 | 16 | 69.57 | 0.00 | 23 | |
| p | $5,157.99 | 2.51 | $200,000.00 | 97.49 | 0.00 | $205,157.99 | ||
| Total | v | 87,395 | 92.83 | 5,039 | 5.35 | 1,714 | 1.82 | 94,148 |
| p | $12,068,686.34 | 58.40 | $6,588,121.52 | 31.88 | $2,009,601.52 | 9.72 | $20,666,409.38 |

AMPS Top 10 Contraventions
Tables 4 to 9 relate to the top 10 most-issued AMPS contraventions from January 2009 to December 2011 for the following categories of contraventions: trade, border, importer/exporter, carrier, and warehouse operator. The tables include net volume and net penalty amount for each contravention for each six-month report period. The amounts are listed in decreasing order by number of net contraventions issued, using the total volume shown in the bottom two lines of the table. Contravention codes are listed across the top of the table and time frames down the left side with respective net volume and net penalty amounts. For specific penalty structures for each contravention, including a description, consult the Master Penalty Document. Charts 7 to 18 correspond to the information contained in the tables and reflect the average volume or penalty amounts for each time period during the January 2009 to December 2011 time frame.
AMPS Top 10 Contraventions
Table 4: Net Volume and Penalty Amount of Top 10 Contraventions
v = Volume, p = Penalty amount
| Report Period | C082 | C353 | C352 | C336 | C005 | |
|---|---|---|---|---|---|---|
| Jan-June 2009 | v | 1164 | 563 | 272 | 999 | 574 |
| p | $77,000.00 | $105,373.43 | $243,472.10 | $285,000.00 | $73,100.00 | |
| July-Dec 2009 | v | 2599 | 7115 | 262 | 1057 | 534 |
| p | $99,900.00 | $181,322.63 | $243,789.70 | $260,200.00 | $77,700.00 | |
| Jan-June 2010 | v | 5807 | 5684 | 1008 | 853 | 405 |
| p | $438,350.00 | $205,384.19 | $368,063.95 | $161,200.00 | $55,325.00 | |
| July-Dec 2010 | v | 7374 | 6331 | 8239 | 1033 | 550 |
| p | $506,200.00 | $191,350.00 | $217,790.13 | $103,300.00 | $87,600.00 | |
| Jan-June 2011 | v | 7094 | 3230 | 1222 | 1068 | 630 |
| p | $470,175.00 | $179,750.00 | $172,075.00 | $106,800.00 | $102,625.00 | |
| July-Dec 2011 | v | 9439 | 31 | 391 | 1295 | 778 |
| p | $576,700.00 | $4,249.67 | $56,088.24 | $129,500.00 | $135,150.00 | |
| Jan 2009 - Dec 2011 | v | 33477 | 22954 | 11394 | 6305 | 3471 |
| p | $2,168,325.00 | $867,429.92 | $1,301,279.12 | $1,046,000.00 | $531,500.00 |
| Report Period | C083 | C358 | C084-C151 | C071 | C070 | |
|---|---|---|---|---|---|---|
| Jan-June 2009 | v | 102 | 163 | 278 | 123 | 107 |
| p | $10,200.00 | $320,015.58 | $9,320.71 | $25,700.00 | $10,700.00 | |
| July-Dec 2009 | v | 188 | 231 | 373 | 167 | 72 |
| p | $18,800.00 | $343,363.77 | $18,394.55 | $25,400.00 | $7,600.00 | |
| Jan-June 2010 | v | 590 | 213 | 245 | 119 | 165 |
| p | $56,450.00 | $248,397.93 | $23,052.27 | $33,500.00 | $23,100.00 | |
| July-Dec 2010 | v | 240 | 145 | 236 | 227 | 711 |
| p | $54,613.66 | $263,000.00 | $37,575.00 | $116,500.00 | $53,800.00 | |
| Jan-June 2011 | v | 600 | 160 | 0 | 271 | 29 |
| p | $46,175.00 | $290,000.00 | $0.00 | $142,050.00 | $34,800.00 | |
| July-Dec 2011 | v | 3 | 282 | 0 | 218 | 16 |
| p | $300.00 | $651,000.00 | $0.00 | $122,750.00 | $19,200.00 | |
| Jan 2009 - Dec 2011 | v | 1723 | 1194 | 1132 | 1125 | 1100 |
| p | $186,538.66 | $2,115,777.28 | $88,342.53 | $465,900.00 | $149,200.00 |


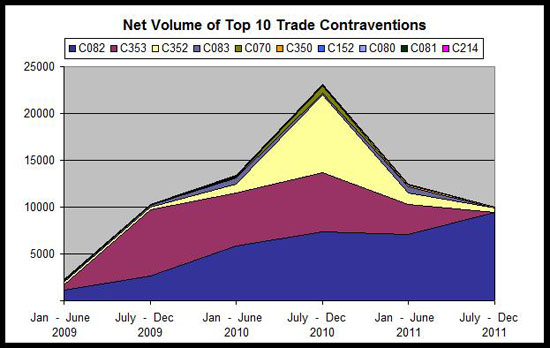
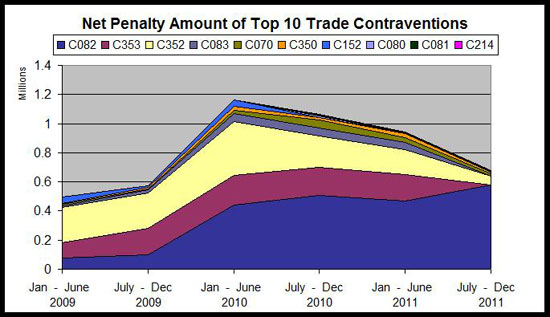
AMPS Top 10 Trade Contraventions
Trade contraventions are AMPS penalties that are issued at post-release verification or during audits. These penalties are primarily issued to importers or owners failing to pay or repay duties as a result of required corrections or drawbacks.
Table 5: Net Volume and Penalty Amount of Top 10 Trade Contraventions
v = Volume, p = Penalty amount
| Report Period | C082 | C353 | C352 | C083 | C070 | |
|---|---|---|---|---|---|---|
| Jan-June 2009 | v | 1164 | 563 | 272 | 102 | 107 |
| p | $77,000.00 | $105,373.43 | $243,472.10 | $10,200.00 | $10,700.00 | |
| July-Dec 2009 | v | 2599 | 7115 | 262 | 188 | 72 |
| p | $99,900.00 | $181,322.63 | $243,789.70 | $18,800.00 | $7,600.00 | |
| Jan-June 2010 | v | 5807 | 5684 | 1008 | 590 | 165 |
| p | $438,350.00 | $205,384.19 | $368,063.95 | $56,450.00 | $23,100.00 | |
| July-Dec 2010 | v | 7374 | 6331 | 8239 | 240 | 711 |
| p | $506,200.00 | $191,350.00 | $217,790.13 | $54,613.66 | $53,800.00 | |
| Jan-June 2011 | v | 7094 | 3230 | 1222 | 600 | 29 |
| p | $470,175.00 | $179,750.00 | $172,075.00 | $46,175.00 | $34,800.00 | |
| July-Dec 2011 | v | 9439 | 31 | 391 | 3 | 16 |
| p | $576,700.00 | $4,249.67 | $56,088.24 | $300.00 | $19,200.00 | |
| Jan 2009 - Dec 2011 | v | 33477 | 22954 | 11394 | 1723 | 1100 |
| p | $2,168,325.00 | $867,429.92 | $1,301,279.12 | $186,538.66 | $149,200.00 |
| Report Period | C350 | C152 | C080 | C081 | C214 | |
|---|---|---|---|---|---|---|
| Jan-June 2009 | v | 6 | 44 | 3 | 3 | |
| p | $2,931.70 | $44,000.00 | $300.00 | $300.00 | ||
| July-Dec 2009 | v | 18 | 11 | 10 | 0 | 0 |
| p | $9,139.09 | $11,000.00 | $1,000.00 | $0.00 | $0.00 | |
| Jan-June 2010 | v | 49 | 42 | 2 | 0 | 23 |
| p | $26,629.72 | $42,600.00 | $250.00 | $0.00 | $2,800.00 | |
| July-Dec 2010 | v | 103 | 20 | 58 | 53 | 19 |
| p | $15,450.00 | $3,000.00 | $8,700.00 | $7,950.00 | $5,700.00 | |
| Jan-June 2011 | v | 182 | 44 | 1 | 1 | 7 |
| p | $28,500.00 | $6,750.00 | $150.00 | $150.00 | $2,100.00 | |
| July-Dec 2011 | v | 86 | 28 | 16 | 3 | 0 |
| p | $12,900.00 | $4,200.00 | $2,200.00 | $450.00 | $0.00 | |
| Jan 2009 - Dec 2011 | v | 444 | 189 | 90 | 57 | 52 |
| p | $95,550.51 | $111,550.00 | $12,600.00 | $8,550.00 | $10,900.00 |
AMPS Top 10 Border Contraventions
Border contraventions are AMPS penalties that are issued at the point of entry. These are primarily issued to carriers, warehouse operators, brokers and duty-free shop licensees, Customs Self Assessment (CSA) clients, exporters and, in some cases, importers.
Table 6: Net Volume and Penalty Amount of Top 10 Border Contraventions
v = Volume, p = Penalty amount
| Report Period | C336 | C005 | C358 | C084-C151 | C071 | |
|---|---|---|---|---|---|---|
| Jan-June 2009 | v | 999 | 574 | 163 | 278 | 123 |
| p | $285,000.00 | $73,100.00 | $320,015.58 | $9,320.71 | $25,700.00 | |
| July-Dec 2009 | v | 1057 | 534 | 231 | 373 | 167 |
| p | $260,200.00 | $77,700.00 | $343,363.77 | $18,394.55 | $25,400.00 | |
| Jan-June 2010 | v | 853 | 405 | 213 | 245 | 119 |
| p | $161,200.00 | $55,325.00 | $248,397.93 | $23,052.27 | $33,500.00 | |
| July-Dec 2010 | v | 1033 | 550 | 145 | 236 | 227 |
| p | $103,300.00 | $87,600.00 | $263,000.00 | $37,575.00 | $116,500.00 | |
| Jan-June 2011 | v | 1068 | 630 | 160 | 0 | 271 |
| p | $106,800.00 | $102,625.00 | $290,000.00 | $0.00 | $142,050.00 | |
| July-Dec 2011 | v | 1295 | 778 | 282 | 0 | 218 |
| p | $129,500.00 | $135,150.00 | $651,000.00 | $0.00 | $122,750.00 | |
| Jan 2009 - Dec 2011 | v | 6305 | 3471 | 1194 | 1132 | 1125 |
| p | $1,046,000.00 | $531,500.00 | $2,115,777.28 | $88,342.53 | $465,900.00 |
| Report Period | C021 | C018 | C033 | C274 | C354 | |
|---|---|---|---|---|---|---|
| Jan-June 2009 | v | 236 | 111 | 86 | 73 | 64 |
| p | $205,000.00 | $13,900.00 | $86,000.00 | $104,000.00 | $192,000.00 | |
| July-Dec 2009 | v | 185 | 182 | 62 | 80 | 99 |
| p | $185,000.00 | $30,900.00 | $62,000.00 | $108,000.00 | $297,000.00 | |
| Jan-June 2010 | v | 171 | 73 | 150 | 94 | 97 |
| p | $281,500.00 | $12,300.00 | $129,000.00 | $108,000.00 | $291,000.00 | |
| July-Dec 2010 | v | 114 | 116 | 82 | 152 | 86 |
| p | $362,000.00 | $59,000.00 | $127,000.00 | $176,000.00 | $258,000.00 | |
| Jan-June 2011 | v | 62 | 78 | 134 | 80 | 89 |
| p | $188,000.00 | $77,750.00 | $212,000.00 | $101,000.00 | $267,000.00 | |
| July-Dec 2011 | v | 43 | 117 | 125 | 125 | 160 |
| p | $118,000.00 | $236,750.00 | $231,000.00 | $220,000.00 | $480,000.00 | |
| Jan 2009 - Dec 2011 | v | 811 | 677 | 639 | 604 | 595 |
| p | $1,339,500.00 | $430,600.00 | $847,000.00 | $817,000.00 | $1,785,000.00 |


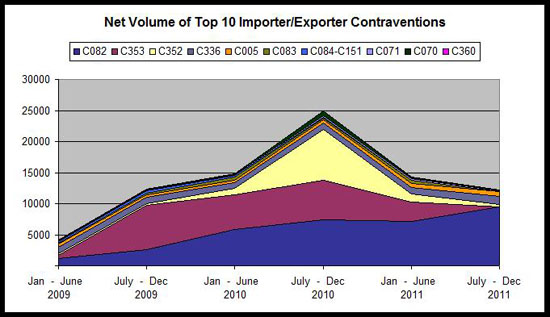
AMPS Top 10 Importer/Exporter Contraventions
An importer is defined as the person or entity that causes the goods to be imported and is responsible for the accounting of the goods and payment of applicable duties and taxes. With respect to goods that are exported, an exporter is defined as the holder of a business number for the purposes of the Customs Act, who exports commercial goods or causes them to be exported. (Importers are also holders of a business number.)
Table 7: Net Volume and Penalty Amount of Top 10 Importer/Exporter Contraventions
v = Volume, p = Penalty Amount
| Report Period | C082 | C353 | C352 | C336 | C005 | |
|---|---|---|---|---|---|---|
| Jan-June 2009 | v | 1164 | 563 | 272 | 997 | 519 |
| p | $77,000.00 | $105,373.43 | $243,472.10 | $284,800.00 | $64,100.00 | |
| July-Dec 2009 | v | 2599 | 7115 | 262 | 1057 | 437 |
| p | $99,900.00 | $181,322.63 | $243,789.70 | $260,200.00 | $57,600.00 | |
| Jan-June 2010 | v | 5807 | 5684 | 1007 | 849 | 368 |
| p | $438,350.00 | $205,384.19 | $367,851.16 | $160,800.00 | $50,175.00 | |
| July-Dec 2010 | v | 7374 | 6331 | 8239 | 1027 | 502 |
| p | $506,200.00 | $191,350.00 | $217,790.13 | $102,700.00 | $79,950.00 | |
| Jan-June 2011 | v | 7094 | 3230 | 1222 | 1066 | 601 |
| p | $470,175.00 | $179,750.00 | $172,075.00 | $106,600.00 | $97,750.00 | |
| July-Dec 2011 | v | 9439 | 31 | 391 | 1288 | 738 |
| p | $576,700.00 | $4,249.67 | $56,088.24 | $128,800.00 | $127,275.00 | |
| Jan 2009 - Dec 2011 | v | 33477 | 22954 | 11393 | 6284 | 3165 |
| p | $2,168,325.00 | $867,429.92 | $1,301,066.33 | $1,043,900.00 | $476,850.00 |
| Report Period | C083 | C084-C151 | C071 | C070 | C360 | |
|---|---|---|---|---|---|---|
| Jan-June 2009 | v | 102 | 278 | 123 | 58 | 72 |
| p | $10,200.00 | $9,320.71 | $25,700.00 | $5,800.00 | $279,950.76 | |
| July-Dec 2009 | v | 188 | 373 | 164 | 7 | 83 |
| p | $18,800.00 | $18,394.55 | $25,100.00 | $1,100.00 | $260,782.61 | |
| Jan-June 2010 | v | 590 | 245 | 119 | 130 | 64 |
| p | $56,450.00 | $23,052.27 | $33,500.00 | $19,600.00 | $175,401.54 | |
| July-Dec 2010 | v | 240 | 236 | 227 | 707 | 109 |
| p | $54,613.66 | $37,575.00 | $116,500.00 | $49,000.00 | $232,000.00 | |
| Jan-June 2011 | v | 600 | 0 | 271 | 14 | 124 |
| p | $46,175.00 | $0.00 | $142,050.00 | $16,800.00 | $250,000.00 | |
| July-Dec 2011 | v | 3 | 0 | 217 | 4 | 94 |
| p | $300.00 | $0.00 | $122,250.00 | $4,800.00 | $194,000.00 | |
| Jan 2009 - Dec 2011 | v | 1723 | 1132 | 1121 | 920 | 546 |
| p | $186,538.66 | $88,342.53 | $465,100.00 | $97,100.00 | $1,392,134.91 |

AMPS Top 10 Carrier Contraventions
A carrier is defined as an individual, partnership, or corporation engaged in the business of transporting goods or persons.
Table 8: Net Volume and Penalty Amount of Top 10 Carrier Contraventions
v = Volume, p = Penalty Amount
| Report Period | C021 | C354 | C033 | C358 | C018 | |
|---|---|---|---|---|---|---|
| Jan-June 2009 | v | 233 | 64 | 82 | 62 | 16 |
| p | $202,000.00 | $192,000.00 | $82,000.00 | $114,833.00 | $4,000.00 | |
| July-Dec 2009 | v | 182 | 99 | 57 | 59 | 88 |
| p | $182,000.00 | $297,000.00 | $57,000.00 | $90,826.75 | $18,700.00 | |
| Jan-June 2010 | v | 168 | 97 | 145 | 45 | 15 |
| p | $277,500.00 | $291,000.00 | $124,000.00 | $55,681.01 | $5,000.00 | |
| July-Dec 2010 | v | 110 | 86 | 73 | 55 | 103 |
| p | $354,000.00 | $258,000.00 | $118,000.00 | $88,000.00 | $55,750.00 | |
| Jan-June 2011 | v | 54 | 89 | 115 | 94 | 31 |
| p | $172,000.00 | $267,000.00 | $193,000.00 | $156,000.00 | $60,000.00 | |
| July-Dec 2011 | v | 38 | 160 | 107 | 126 | 116 |
| p | $108,000.00 | $480,000.00 | $212,000.00 | $219,000.00 | $234,250.00 | |
| Jan 2009 - Dec 2011 | v | 785 | 595 | 579 | 441 | 369 |
| p | $1,295,500.00 | $1,785,000.00 | $786,000.00 | $724,340.76 | $377,700.00 |
| Report Period | C005 | C355 | C369 | C070 | C274 | |
|---|---|---|---|---|---|---|
| Jan-June 2009 | v | 54 | 93 | 49 | 33 | |
| p | $8,900.00 | $0.00 | $4,900.00 | $62,000.00 | ||
| July-Dec 2009 | v | 97 | 2 | 44 | 65 | 33 |
| p | $20,100.00 | $0.00 | $15,900.00 | $6,500.00 | $58,000.00 | |
| Jan-June 2010 | v | 36 | 3 | 36 | 35 | 11 |
| p | $5,000.00 | $0.00 | $20,400.00 | $3,500.00 | $19,000.00 | |
| July-Dec 2010 | v | 45 | 2 | 18 | 4 | 18 |
| p | $7,200.00 | $0.00 | $9,000.00 | $4,800.00 | $30,000.00 | |
| Jan-June 2011 | v | 27 | 4 | 6 | 15 | 16 |
| p | $4,575.00 | $0.00 | $3,000.00 | $18,000.00 | $30,000.00 | |
| July-Dec 2011 | v | 40 | 216 | 28 | 12 | 57 |
| p | $7,875.00 | $0.00 | $14,500.00 | $14,400.00 | $149,000.00 | |
| Jan 2009 - Dec 2011 | v | 299 | 227 | 225 | 180 | 168 |
| p | $53,650.00 | $0.00 | $62,800.00 | $52,100.00 | $348,000.00 |


AMPS Top 10 Warehouse Operator Contraventions
Warehouse contraventions are mostly applicable to carriers, exporters, duty-free shop licensees, sufferance warehouse licensees and bonded warehouse licensees.
Table 9: Net Volume and Penalty Amount of Top 10 Warehouse Contraventions
v = Volume, p = Penalty Amount
| Report Period | C358 | C058 | C048 | C063 | C049 | |
|---|---|---|---|---|---|---|
| Jan-June 2009 | v | 99 | 1 | 11 | 7 | 9 |
| p | $203,182.58 | $1,000.00 | $10,500.00 | $8,500.00 | $5,000.00 | |
| July-Dec 2009 | v | 167 | 0 | 21 | 4 | 5 |
| p | $247,537.02 | $0.00 | $11,000.00 | $2,000.00 | $7,000.00 | |
| Jan-June 2010 | v | 166 | 122 | 19 | 17 | 15 |
| p | $190,716.92 | $75,200.00 | $16,500.00 | $13,000.00 | $9,500.00 | |
| July-Dec 2010 | v | 88 | 96 | 90 | 10 | 14 |
| p | $173,000.00 | $28,800.00 | $37,750.00 | $22,000.00 | $15,000.00 | |
| Jan-June 2011 | v | 54 | 183 | 46 | 13 | 10 |
| p | $122,000.00 | $25,000.00 | $25,750.00 | $13,000.00 | $11,000.00 | |
| July-Dec 2011 | v | 154 | 1 | 31 | 11 | 8 |
| p | $430,000.00 | $300.00 | $21,750.00 | $11,000.00 | $8,000.00 | |
| Jan 2009 - Dec 2011 | v | 728 | 403 | 218 | 62 | 61 |
| p | $1,366,436.52 | $130,300.00 | $123,250.00 | $69,500.00 | $55,500.00 |
| Report Period | C033 | C274 | C066 | C336 | C347 | |
|---|---|---|---|---|---|---|
| Jan-June 2009 | v | 4 | 1 | 5 | 2 | 6 |
| p | $4,000.00 | $1,000.00 | $22,714.47 | $200.00 | $600.00 | |
| July-Dec 2009 | v | 1 | 3 | 3 | 0 | 7 |
| p | $1,000.00 | $3,000.00 | $10,100.53 | $0.00 | $700.00 | |
| Jan-June 2010 | v | 3 | 2 | 0 | 4 | 1 |
| p | $3,000.00 | $2,000.00 | $0.00 | $400.00 | $100.00 | |
| July-Dec 2010 | v | 7 | 0 | 4 | 6 | 0 |
| p | $7,000.00 | $0.00 | $4,000.00 | $600.00 | $0.00 | |
| Jan-June 2011 | v | 19 | 2 | 11 | 2 | 0 |
| p | $19,000.00 | $2,000.00 | $11,000.00 | $200.00 | $0.00 | |
| July-Dec 2011 | v | 14 | 27 | 4 | 7 | 0 |
| p | $15,000.00 | $25,000.00 | $4,000.00 | $700.00 | $0.00 | |
| Jan 2009 - Dec 2011 | v | 48 | 35 | 27 | 21 | 14 |
| p | $49,000.00 | $33,000.00 | $51,815.00 | $2,100.00 | $1,400.00 |


AMPS Appeals
Table 10 depicts the number of appeals filed, all contraventions issued (gross) and corresponding results from January 2009 to December 2011. Of all AMPS contraventions that were appealed, the Recourse Directorate upheld 60 percent, while 40 percent were cancelled or administratively closed. Four percent of all AMPS penalties issued were appealed while 60 percent of those were successful.
Note: Decisions taken by the Recourse Directorate in a given year may also include appeals filed in previous years.
| Report period | Total # Commercial Releases | Exams | % Exams to Releases | AMPS Issued | % AMPS issued to Exams | % AMPS issued to Releases | Appeals Filed | % Appeals Filed to AMPS Issued |
|---|---|---|---|---|---|---|---|---|
| Jan-June 2009 | 5,545,989 | 104,302 | 1.88 | 7,131 | 6.84 | 0.13 | 666 | 9.34 |
| July-Dec 2009 | 5,909,337 | 109,719 | 1.86 | 15,069 | 13.73 | 0.26 | 763 | 5.06 |
| Jan-June 2010 | 6,273,177 | 115,495 | 1.84 | 25,673 | 22.23 | 0.41 | 592 | 2.31 |
| July-Dec 2010 | 6,483,713 | 105,666 | 1.63 | 29,448 | 27.87 | 0.45 | 622 | 2.11 |
| Jan-June 2011 | 6,627,929 | 107,829 | 1.63 | 19,222 | 17.83 | 0.29 | 459 | 2.39 |
| July-Dec 2011 | 6,769,143 | 100,798 | 1.49 | 14,754 | 14.64 | 0.22 | 571 | 3.87 |
| Total | 37,609,288 | 643,809 | 1.72 | 111,297 | 17.19 | 1.75 | 3,673 | 4.18 |
| Report period | Pen. Upheld | Pen. Cancelled | Admin closure | Decision Taken | |||||
|---|---|---|---|---|---|---|---|---|---|
| # | % of Dec Taken | # | % of Dec Taken | % of AMPS issued | # | % of Dec Taken | # | % of AMPS issued | |
| Jan-June 2009 | 399 | 61.38 | 233 | 35.85 | 3.27 | 18 | 2.77 | 650 | 9.12 |
| July-Dec 2009 | 739 | 72.17 | 272 | 26.56 | 1.81 | 13 | 1.27 | 1,024 | 6.80 |
| Jan-June 2010 | 497 | 62.44 | 269 | 33.79 | 1.05 | 30 | 3.77 | 796 | 3.10 |
| July-Dec 2010 | 346 | 43.03 | 452 | 56.22 | 1.53 | 6 | 0.75 | 804 | 2.73 |
| Jan-June 2011 | 508 | 61.73 | 312 | 37.91 | 1.62 | 2 | 0.24 | 823 | 4.28 |
| July-Dec 2011 | 410 | 58.32 | 287 | 40.83 | 1.95 | 7 | 1.00 | 703 | 4.76 |
| Totals | 2,899 | 59.85 | 1,825 | 38.53 | 1.87 | 76 | 1.63 | 4,800 | 5.13 |